
 Facebook
 X
X
 Pinterest
 Copy Link
The Gardner Report – Q1 2021

The following analysis of the Western Washington real estate market is provided by Windermere Real Estate Chief Economist Matthew Gardner. We hope that this information may assist you with making better-informed real estate decisions. For further information about the housing market in your area, please don’t hesitate to contact me!
REGIONAL ECONOMIC OVERVIEW
In the summer and fall of 2020, Western Washington regained some of the jobs lost due to COVID-19, but employment levels in the region have been in a holding pattern ever since. As of February, the region had recovered 132,000 of the 297,000 jobs that were lost, but that still leaves the area down by 165,000 positions. Given the announcement that several counties may have to roll back to phase 2 of reopening, I would not be surprised to see businesses hold off on plans to add to their payrolls until the picture becomes clearer. Even with this “pause” in the job recovery, the region’s unemployment rate ticked down to 6.1% from the December rate of 6.4% (re-benchmarking in 2020 showed the December rate was higher than the originally reported 5.5%). The lowest rate was in King County (5.3%) and the highest rate was in Grays Harbor County, which registered at 9.2%. Despite the adjustment to the 2020 numbers, my forecast still calls for employment levels to increase as we move through the year, though the recovery will be slower in areas where COVID-19 infection rates remain elevated.
WESTERN WASHINGTON HOME SALES
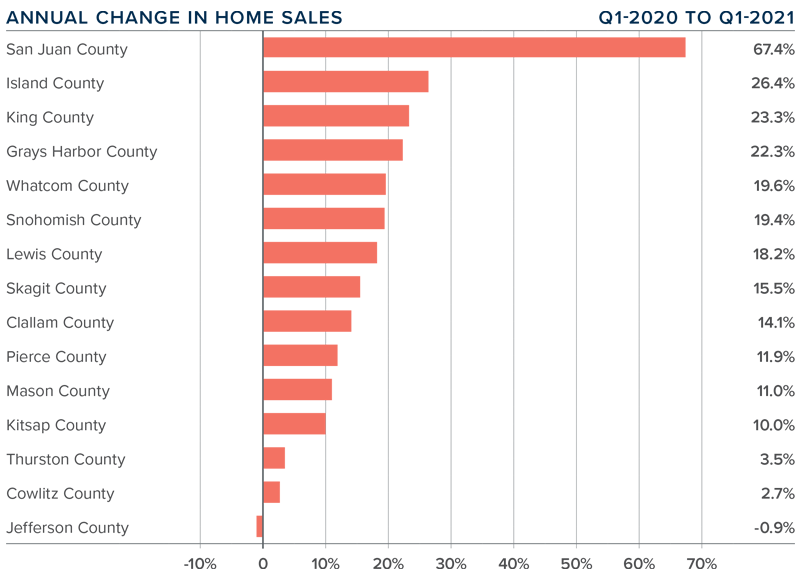
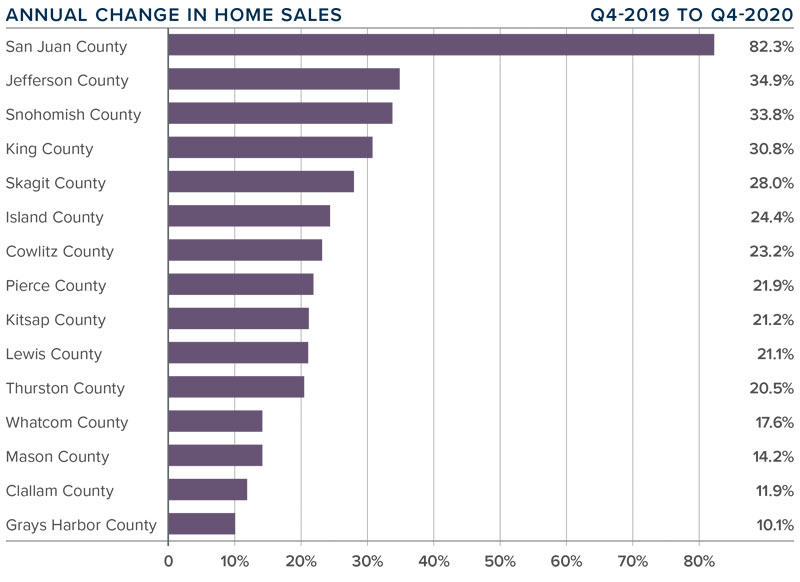
❱ Sales in the first quarter were impressive, with 15,893 home sales. This is an increase of 17.5% from the same period in 2020, but 32% lower than in the final quarter of last year—a function of low levels of inventory.
❱ Listing activity continues to be well below normal levels, with total available inventory 40.7% lower than a year ago, and 35.5% lower than in the fourth quarter of 2020.
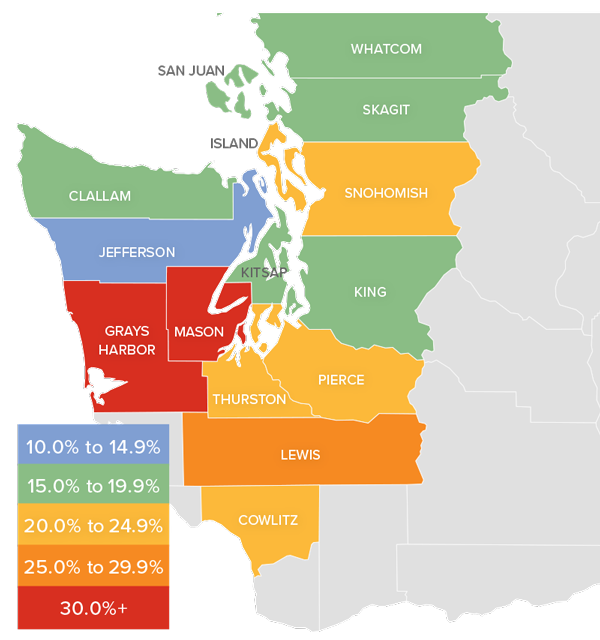
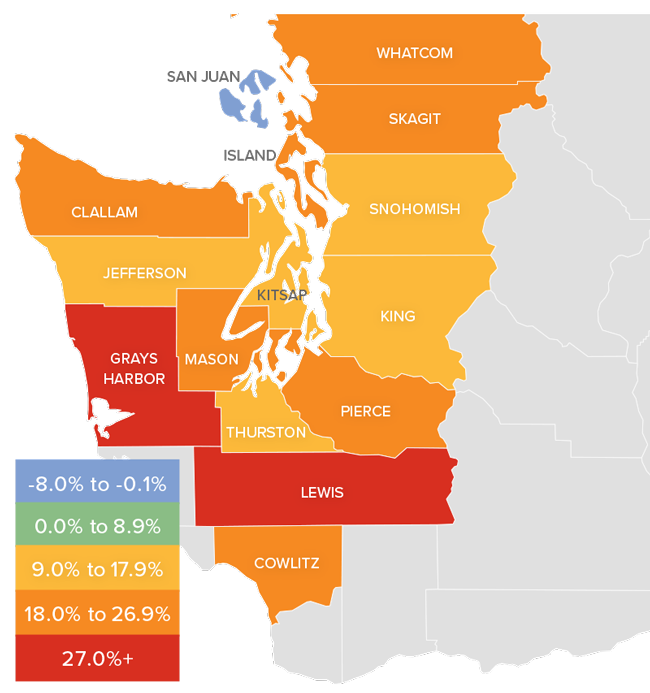
❱ Sales rose in all counties other than Jefferson, though the drop there was only one unit. There were significant increases in almost every other county, but sales growth was more muted in Cowlitz and Thurston counties. San Juan County again led the way, likely due to ongoing interest from second-home buyers.
❱ The ratio of pending sales (demand) to active listings (supply) shows how competitive the market is. Western Washington is showing pendings outpacing new listings by a factor of almost six to one. The housing market is as tight now as I have ever seen it.
WESTERN WASHINGTON HOME PRICES
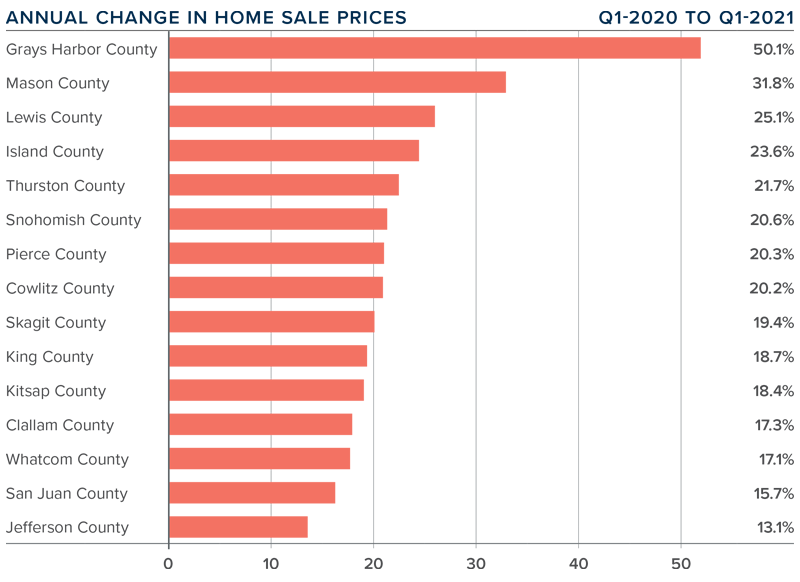
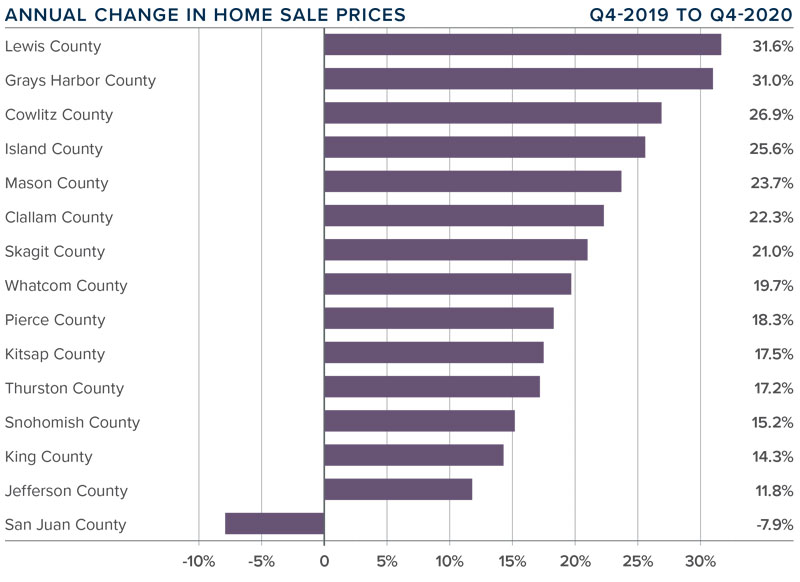
❱ Home price growth in Western Washington continues to trend well above the long-term average, with prices 21.3% higher than a year ago. The average home sale price was $635,079.
❱ Compared to the same period a year ago, price growth was strongest in Grays Harbor and Mason counties, but all markets saw double-digit price growth compared to a year ago.
❱ Home prices were also 2.9% higher than in the final quarter of 2020, which was good to see given that 30-year mortgage rates rose .4% in the quarter.
❱ I expect to see mortgage rates continue to trend higher as we move through the year, but they will remain significantly lower than the long-term average. Any increase in rates can act as a headwind to home-price growth, but excessive demand will likely cause prices to continue to rise.
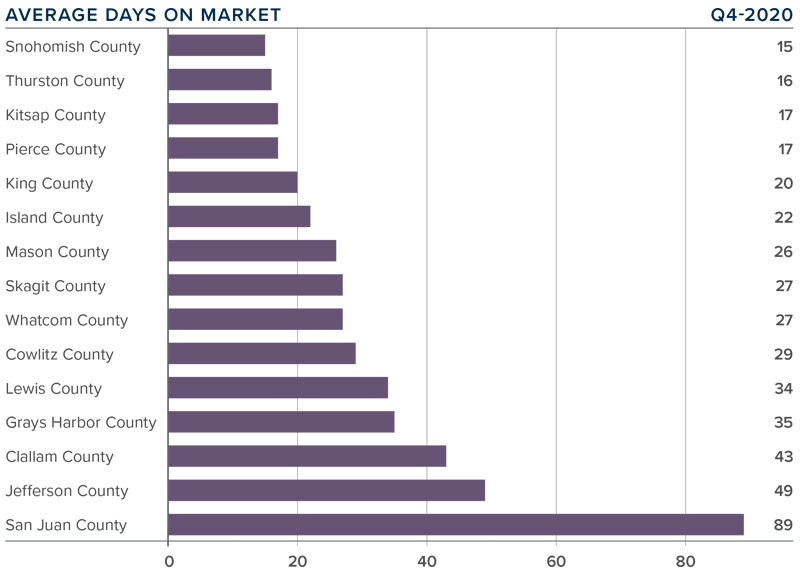
DAYS ON MARKET
❱ The market in early 2021 continued to show far more demand than supply, which pushed the average time it took to sell a home down 25 days compared to a year ago. It took 2 fewer days to sell a home than it did in the final quarter of 2020.
❱ Snohomish and Thurston counties were the tightest markets in Western Washington, with homes taking an average of only 15 days to sell. The greatest drop in market time was in San Juan County, where it took 52 fewer days to sell a home than it did a year ago.
❱ Across the region, it took an average of only 29 days to sell a home in the quarter. All counties saw market time decrease from the first quarter of 2020.
❱ Very significant demand, in concert with woefully low levels of supply, continues to make the region’s housing market very competitive. This will continue to be a frustration for buyers.

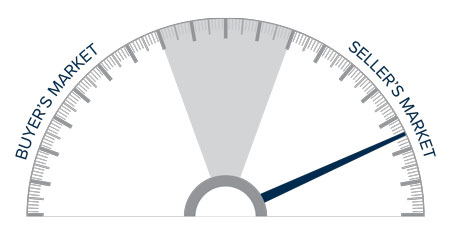
CONCLUSIONS

This speedometer reflects the state of the region’s real estate market using housing inventory, price gains, home sales, interest rates, and larger economic factors.
Demand is very strong and, even in the face of rising mortgage rates, buyers are still out in force. With supply still lagging significantly, it staunchly remains a seller’s market. As such, I am moving the needle even further in their favor.
As I mentioned in last quarter’s Gardner Report, 2021 will likely see more homeowners make the choice to sell and move if they’re allowed to continue working remotely. On the one hand, this is good for buyers because it means more listings to choose from. However, if those sellers move away from the more expensive core markets into areas where housing is cheaper, it could lead to increased competition and affordability issues for the local buyers in those markets.
ABOUT MATTHEW GARDNER

As Chief Economist for Windermere Real Estate, Matthew Gardner is responsible for analyzing and interpreting economic data and its impact on the real estate market on both a local and national level. Matthew has over 30 years of professional experience both in the U.S. and U.K.
In addition to his day-to-day responsibilities, Matthew sits on the Washington State Governors Council of Economic Advisors; chairs the Board of Trustees at the Washington Center for Real Estate Research at the University of Washington; and is an Advisory Board Member at the Runstad Center for Real Estate Studies at the University of Washington where he also lectures in real estate economics.
This post originally appeared on the Windermere.com blog
Washington Ranked Best State in the Nation, Again

Once again, Washington has been ranked as the best state in the country, according to a new report from U.S. News and World Report. The Evergreen State has held the honor since 2019, based on its strength in categories like education, healthcare and broadband access.
Washington rank first for GDP growth and broadband access, and is tied for first when it comes to government credit rating scores. Our state is third for infrastructure, and in the top ten for economy.
In healthcare, our state ranks 8th overall, with only 9.5% of the population without health insurance — lower than the national average of 12.9%. We also have a lower obesity rate of only 28.3%, compared to 32.1% nationally.
In education, Washington graduates finish school with about $4,000 less debt than their peers in other states. Overall, the state ranks second for higher education. Washington’s high school graduation rate of 86.7% also beats the national average of 85.3%.
After Washington, the report ranked Minnesota second and Utah third. Mississippi and Louisiana bring up the rear, at numbers 49 and 50, respectively.
While Washington was ranked first overall, our state definitely still has areas for improvement. Washington’s lowest ranking was 25th place for affordability, and within that category it was ranked 44th for the cost of daily life and housing.
Although there are some areas to improve on, there’s definitely a reason so many people enjoy life here in the Evergreen State. With a little work, hopefully Washington will continue to defend its title as the best state in the nation.
This article was originally posted on King 5 and GettheWReport
Local Market Update – February 2021
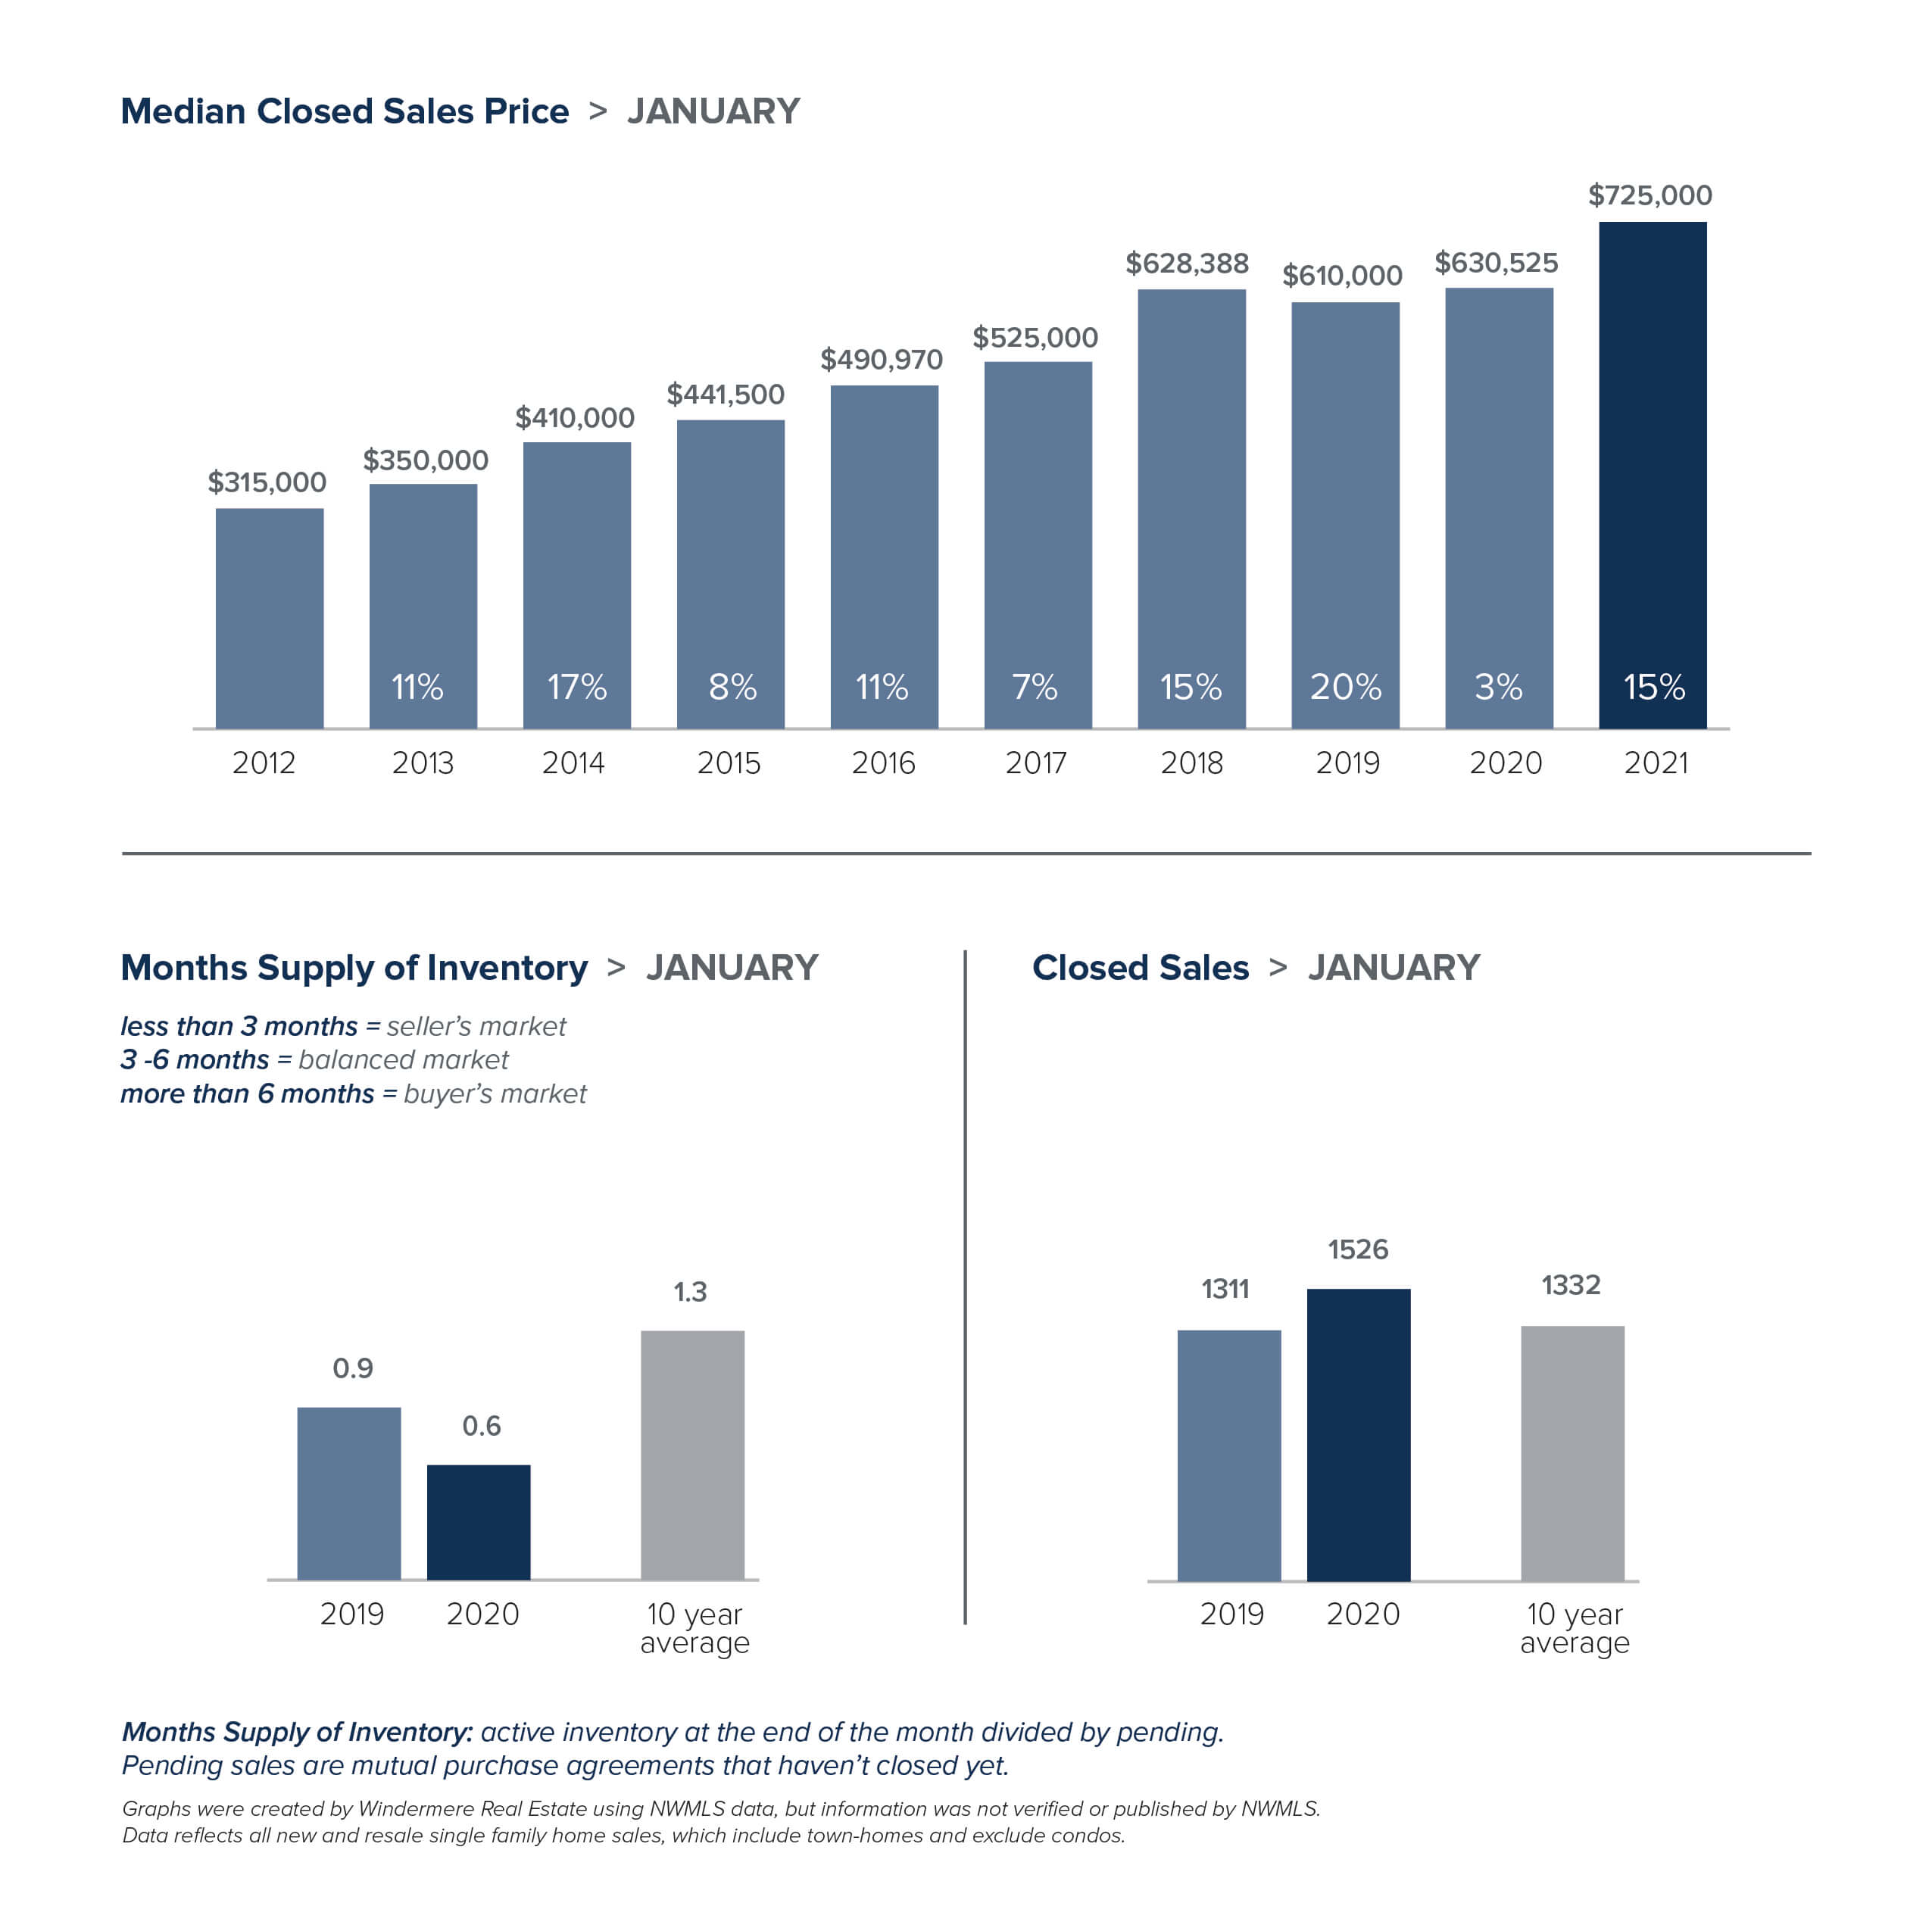
This winter’s real estate market is looking more like a typical spring market. Sales were up, competition was fierce and prices continued to rise.
Lack of inventory still presents a huge issue. At the end of January there were only 1,055 single-family homes on the market in all of King County, 33% fewer than a year ago. If that wasn’t tight enough, Snohomish County had only 298 single-family homes for sale, 63% fewer than a year ago. Condos remain a bright spot for buyers frustrated by the frenzied market. January saw a nearly 50% increase in the number of condos for sale in King County. However, the increase in inventory didn’t translate into a drop in price. The median condo price was flat for the county, up 10% in Seattle and up 7% on the Eastside. Those looking for a relative bargain should consider Southwest and Southeast King County where the median condo prices were $254,275 and $269,900 respectively.
The large imbalance between supply and demand sent prices higher. Home prices here are climbing at the second-fastest rate in the nation. The median price of a single-family home in King County was $725,000, a 15% jump from a year ago. Seattle home prices increased 10% to $791,471. Inventory on the Eastside was down 58%, sending the median home price soaring 29% to $1.15 million. Snohomish County saw prices rise 18% to $599,990, well surpassing its previous high of $575,000.
While low interest rates take some of the sting out of rising prices, multiple offers over asking price have become the norm and are expected to continue. The easing of COVID restrictions may add yet more competition. Both King and Snohomish counties have moved into Phase 2 of the Healthy Washington plan, which allows open houses to resume with up to 10 people socially distanced.
All signs point to this strong seller’s market continuing for some time. The person who represents you as a buyer can make the difference in owning a home or not. Brokers are advising buyers to create a plan that prioritizes their wish list and sets realistic expectations in this hyper-competitive market.
The charts below provide a brief overview of market activity. If you are interested in more information, every Monday Windermere Chief Economist Matthew Gardner provides an update regarding the impact of COVID-19 on the US economy and housing market. You can get Matthew’s latest update here.
EASTSIDE

KING COUNTY
SEATTLE

SNOHOMISH COUNTY

VIEW FULL SNOHOMISH COUNTY REPORT
This post originally appeared on GetTheWReport.com
Q4 2020 Western Washington Real Estate Market Update

The following analysis of the Western Washington real estate market is provided by Windermere Real Estate Chief Economist Matthew Gardner. We hope that this information may assist you with making better-informed real estate decisions. For further information about the housing market in your area, please don’t hesitate to contact me!
REGIONAL ECONOMIC OVERVIEW
After the COVID-19-induced declines, employment levels in Western Washington continue to rebuild. Interestingly, the state re-benchmarked employment numbers, which showed that the region lost fewer jobs than originally reported. That said, regional employment is still 133,000 jobs lower than during the 2020 peak in February. The return of jobs will continue, but much depends on new COVID-19 infection rates and when the Governor can reopen sections of the economy that are still shut down. Unemployment levels also continue to improve. At the end of the quarter, the unemployment rate was a very respectable 5.5%, down from the peak rate of 16.6% in April. The rate varies across Western Washington, with a low of 4.3% in King County and a high of 9.6% in Grays Harbor County. My current forecast calls for employment levels to continue to improve as we move through the spring. More robust growth won’t happen until a vaccine becomes widely distributed, which is unlikely to happen before the summer.
WESTERN WASHINGTON HOME SALES
❱ Sales continued to impress, with 23,357 transactions in the quarter. This was an increase of 26.6% from the same period in 2019, but 8.3% lower than in the third quarter of last year, likely due to seasonality.
❱ Listing activity remained very low, even given seasonality. Total available inventory was 37.3% lower than a year ago and 31.2% lower than in the third quarter of 2020.
❱ Sales rose in all counties, with San Juan County seeing the greatest increase. This makes me wonder if buyers are actively looking in more remote markets given ongoing COVID-19 related concerns.
❱ Pending sales—a good gauge of future closings—were 25% higher than a year ago but down 31% compared to the third quarter of 2020. This is unsurprising, given limited inventory and seasonal factors.
WESTERN WASHINGTON HOME PRICES
❱ Home price growth in Western Washington continued the trend of above-average appreciation. Prices were up 17.4% compared to a year ago, with an average sale price of $617,475.
❱ Year-over year price growth was strongest in Lewis and Grays Harbor counties. Home prices declined in San Juan County which is notoriously volatile because of its small size.
❱ It is interesting to note that home prices were only 1% higher than third quarter of 2020. Even as mortgage rates continued to drop during the quarter, price growth slowed, and we may well be hitting an affordability ceiling in some markets.
❱ Mortgage rates will stay competitive as we move through 2021, but I expect to see price growth moderate as we run into affordability issues, especially in the more expensive counties.
DAYS ON MARKET
❱ 2020 ended with a flourish as the average number of days it took to sell a home in the final quarter dropped by a very significant 16 days compared to a year ago.
❱ Snohomish County was again the tightest market in Western Washington, with homes taking an average of only 15 days to sell. The only county that saw the length of time it took to sell a home rise compared to the same period a year ago was small Jefferson County, but it was only an increase of four days.
❱ Across the region, it took an average of 31 days to sell a home in the quarter. It is also worth noting that, even as we entered the winter months, it took an average of five fewer days to sell a home than in the third quarter of last year.
❱ The takeaway here is that demand clearly remains strong, and competition for the few homes available to buy continues to push days on market lower.
CONCLUSIONS
This speedometer reflects the state of the region’s real estate market using housing inventory, price gains, home sales, interest rates, and larger economic factors.
Demand has clearly not been impacted by COVID-19, mortgage rates are still very favorable, and limited supply is causing the region’s housing market to remain incredibly active. Because of these conditions, I am moving the needle even further in favor of sellers.
2021 is likely to lead more homeowners to choose to move if they can work from home, which will continue to drive sales growth and should also lead to more inventory. That said, affordability concerns in markets close to Western Washington’s job centers, in combination with modestly rising mortgage rates, should slow the rapid home price appreciation we have seen for several years. I, for one, think that is a good thing.
ABOUT MATTHEW GARDNER
As Chief Economist for Windermere Real Estate, Matthew Gardner is responsible for analyzing and interpreting economic data and its impact on the real estate market on both a local and national level. Matthew has over 30 years of professional experience both in the U.S. and U.K.
In addition to his day-to-day responsibilities, Matthew sits on the Washington State Governors Council of Economic Advisors; chairs the Board of Trustees at the Washington Center for Real Estate Research at the University of Washington; and is an Advisory Board Member at the Runstad Center for Real Estate Studies at the University of Washington where he also lectures in real estate economics.
This post originally appeared on the Windermere.com Blog
Local Market Update – January 2021
The end of 2020 marked a most unusual year, and the real estate market was no exception. While homes sales usually take a holiday during December, this year saw the continuation of an exceptionally strong and competitive market. New listings, closed sales and home prices all went up. With supply nowhere close to meeting demand, the strong market is expected to extend into 2021.
Inventory continues to be the biggest challenge for buyers. While King County had a 62% increase in new listings compared to a year ago, homes were snapped up quickly, leaving the county with just over two weeks of available inventory at the end of the month. The supply of single-family homes was down 35% year-over-year. Buyers considering a condo had far more choices. Inventory was up 45%, but at about five weeks of available units the condo market is still significantly short of the four month supply that is considered balanced. Inventory in Snohomish County was even more strained, with the month end showing only a one-week supply of homes. At the end of December there were only 373 homes on the market in all of Snohomish County, a 63% drop from a year ago. With inventory this tight, it’s more important than ever for buyers to work with their agent on a strategic plan for getting the home they want.
Low inventory and high demand continued to push prices upward. The median single-family home price in King County was up 10% over a year ago to $740,000. Price increases varied significantly by area. Seattle home prices were up 10%. The traditionally more affordable area of Southwest King County, which includes Federal Way and Burien, saw prices jump 15%. And on the Eastside, the most expensive market in King County, home prices soared 17% — the largest increase of any area in the county. Home prices in Snohomish County rose 12% to $573,495, just shy of its all-time high of $575,000.
With 2021 ushering in a new record low for interest rates, and inventory at its tightest in recent memory, 2021 is expected to remain a very competitive market.
Windermere Chief Economist Matthew Gardner’s prediction: “As we move into 2021, I expect continued strong demand from buyers, but unfortunately, the likelihood that there will be any significant increase in inventory is slim. As a result, I believe prices will continue to rise, which is good news for sellers, but raises concerns about affordability. This, combined with modestly rising mortgage rates, could end up taking some steam out of the market but overall, I expect housing to continue being a very bright spot in the Puget Sound economy.”
The charts below provide a brief overview of market activity. If you are interested in more information, every Monday Windermere Chief Economist Matthew Gardner provides an update regarding the impact of COVID-19 on the US economy and housing market. You can get Matthew’s latest update here.
EASTSIDE

KING COUNTY

SEATTLE

SNOHOMISH COUNTY

VIEW FULL SNOHOMISH COUNTY REPORT
This post originally appeared on GetTheWReport.com
Seattle Ranked as Most Competitive Market in the Country

Condo deck view of Gas Works Park and Aurora Bridge with orange afterglow sky
In news that won’t surprise anyone who’s tried to buy a home in Seattle in the last few months, the Emerald City has recently been ranked as the single most competitive market in the country. The study, released by Lombardo Homes, places Seattle first, followed closely behind by Omaha, Nebraska and Lexington, Kentucky.
According to the study, in Seattle 71% of listed homes are off the market within two weeks, spending a median of just 10 days on the market. In Omaha and Kentucky, 67% of homes are off the market within two weeks, spending a median of 13 and 15 days on the market, respectively.
The West coast at large is a hotbed of competition, with Portland coming in at number 6 in the ranking, followed by Sacramento and Oakland at numbers 8 and 9, respectively.
The study also suggests that buyers feel the market competition has actually increased since the pandemic began, with an average of 3 out of 4 buyers reporting having seen a home go off the market before they’ve had a chance to look at it.
The study revealed that 73% of buyers had to compete in multiple offer situations, and 73% had a home close before they could view it or make an offer. Interestingly, 53% of buyers also said the pandemic has caused them to accelerate their plans to buy a house.
Among the things buyers are most looking for in a home, Lombardo’s study indicated that the top consideration for buyers in October was the location of the home, as opposed to the home’s price, as indicated in a May survey. Buyers are now also considering kitchen size and room size as top features, whereas floor plan and storage space were more important in May.
One in three buyers also said home office space was their most important consideration in 2020. About 82% of buyers said they would go over budget for their perfect home during the pandemic, but 63% had to lower their overall budget due to the pandemic.
With the intense competition in mind, for buyers to get most everything they want they should be prepared to pounce on the right home when it comes up. Given how much time we’re spending indoors these days, home might be more important than ever.
This article was originally posted on Seattle P-I by Becca Savransky, and on GettheWReport.com
Local Market Update – December 2020

Nothing about 2020 is normal, and that includes real estate trends. The housing market typically slows significantly during the holiday season, but that is not the case this year. Buyer interest is strong, sales are up, and prices have followed suit.
A recent report ranked our area as the most competitive real estate market in the country, with 71% of homes selling within two weeks. While the number of new listings in November were up compared to a year ago, there just wasn’t enough inventory to meet the current surge in demand.
In King County there were 37% fewer single-family homes on the market – 1,621 homes this November vs. 2,592 a year ago. Inventory in Snohomish County is even more strained. At the end of the month there were just 416 homes for sale as compared to 1,204 a year ago, a 65% drop. Both counties had about a two week supply of homes at the end of November. A four month supply of inventory is considered balanced. Buyers in the market for a condominium in King County had much more options. Condo inventory was up 39% over last year.
The inventory-starved market sent home prices higher. The median single-family home price in King County was up 10% over a year ago to $730,500. Home prices in Snohomish County rose 14% to $566,000. In a survey of homebuyers looking for a home during Covid-19, 82% said they would go over budget to get their ideal home. Record-low interest rates have helped soften the blow of soaring prices a bit. According to Freddie Mac, rates on a 30-year fixed-rate mortgage fell to their lowest level, at 2.71%, for the 14th time this year.
With low inventory and high demand, buyers need to be ready to compete. That means being pre-approved or willing to offer cash, and working with an agent on a plan that includes counter-offers, escalation clauses and other strategies to help win the sale. As many consider working remotely long-term, our home has become more important to us than ever.
The charts below provide a brief overview of market activity. If you are interested in more information, every Monday Windermere Chief Economist Matthew Gardner provides an update regarding the impact of COVID-19 on the US economy and housing market. You can get Matthew’s latest update here.
EASTSIDE

KING COUNTY

SEATTLE

SNOHOMISH COUNTY

VIEW FULL SNOHOMISH COUNTY REPORT
This post originally appeared on GetTheWReport.com
Local Market Update – November 2020
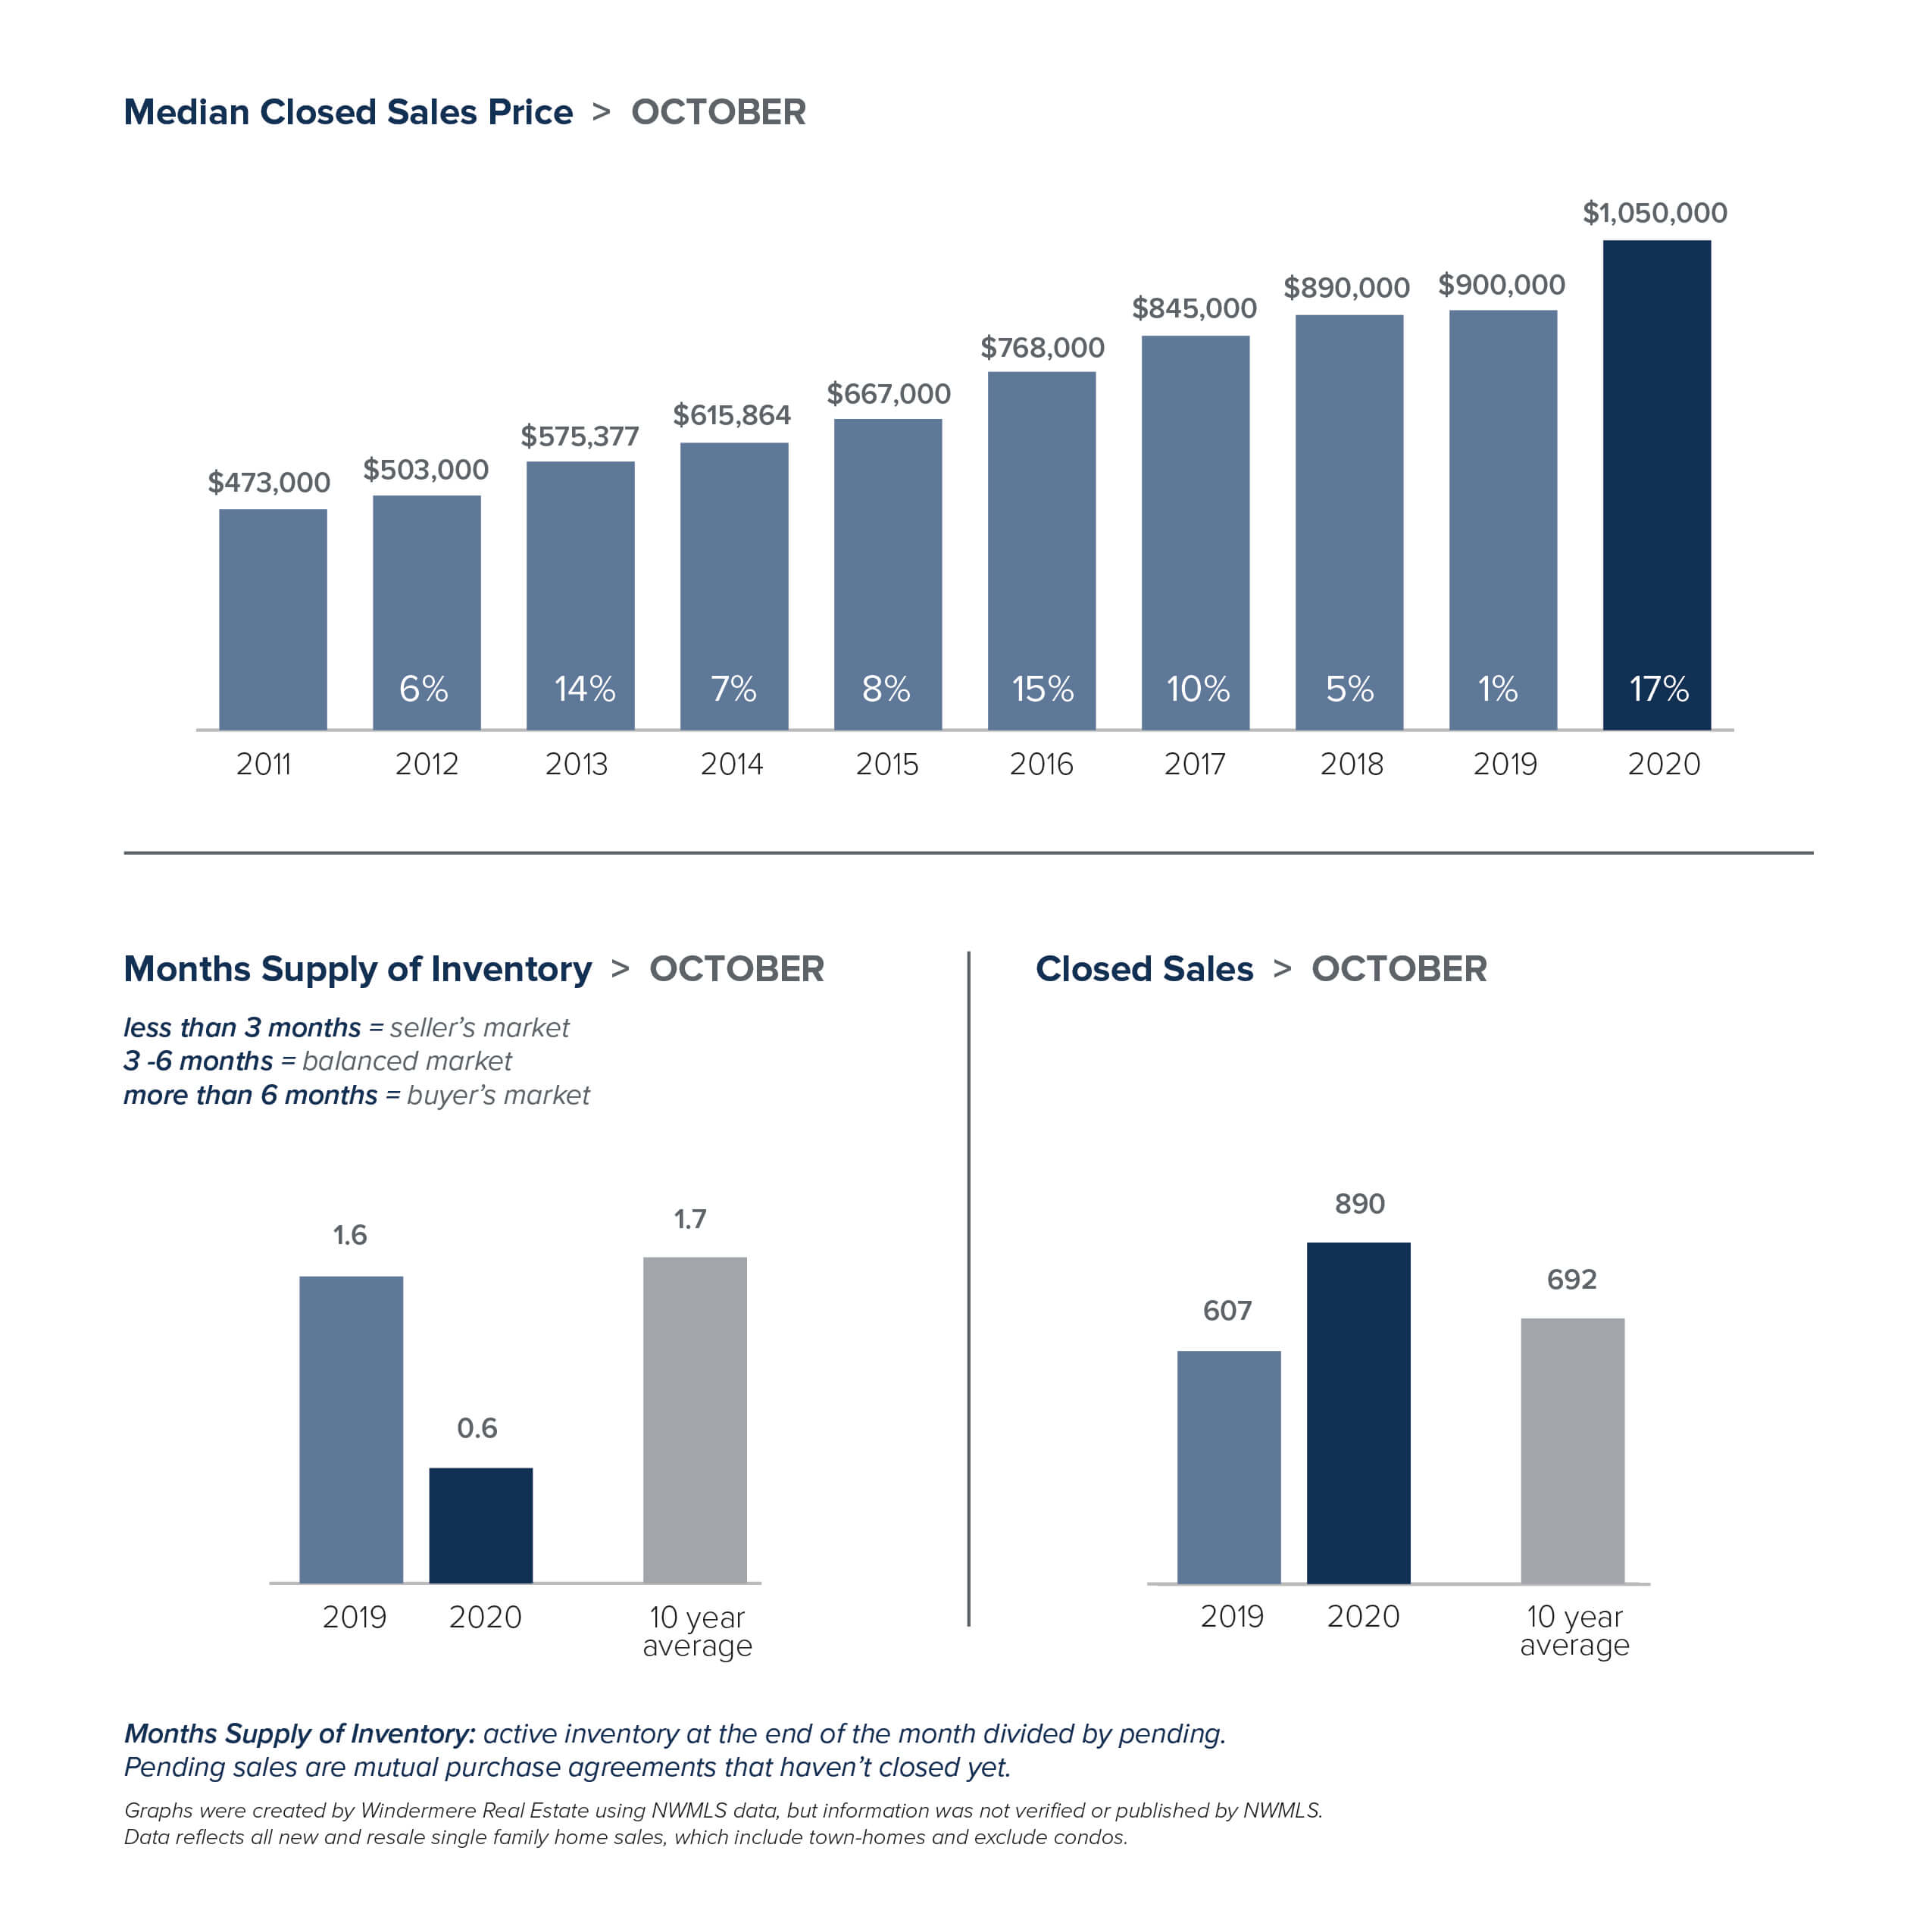
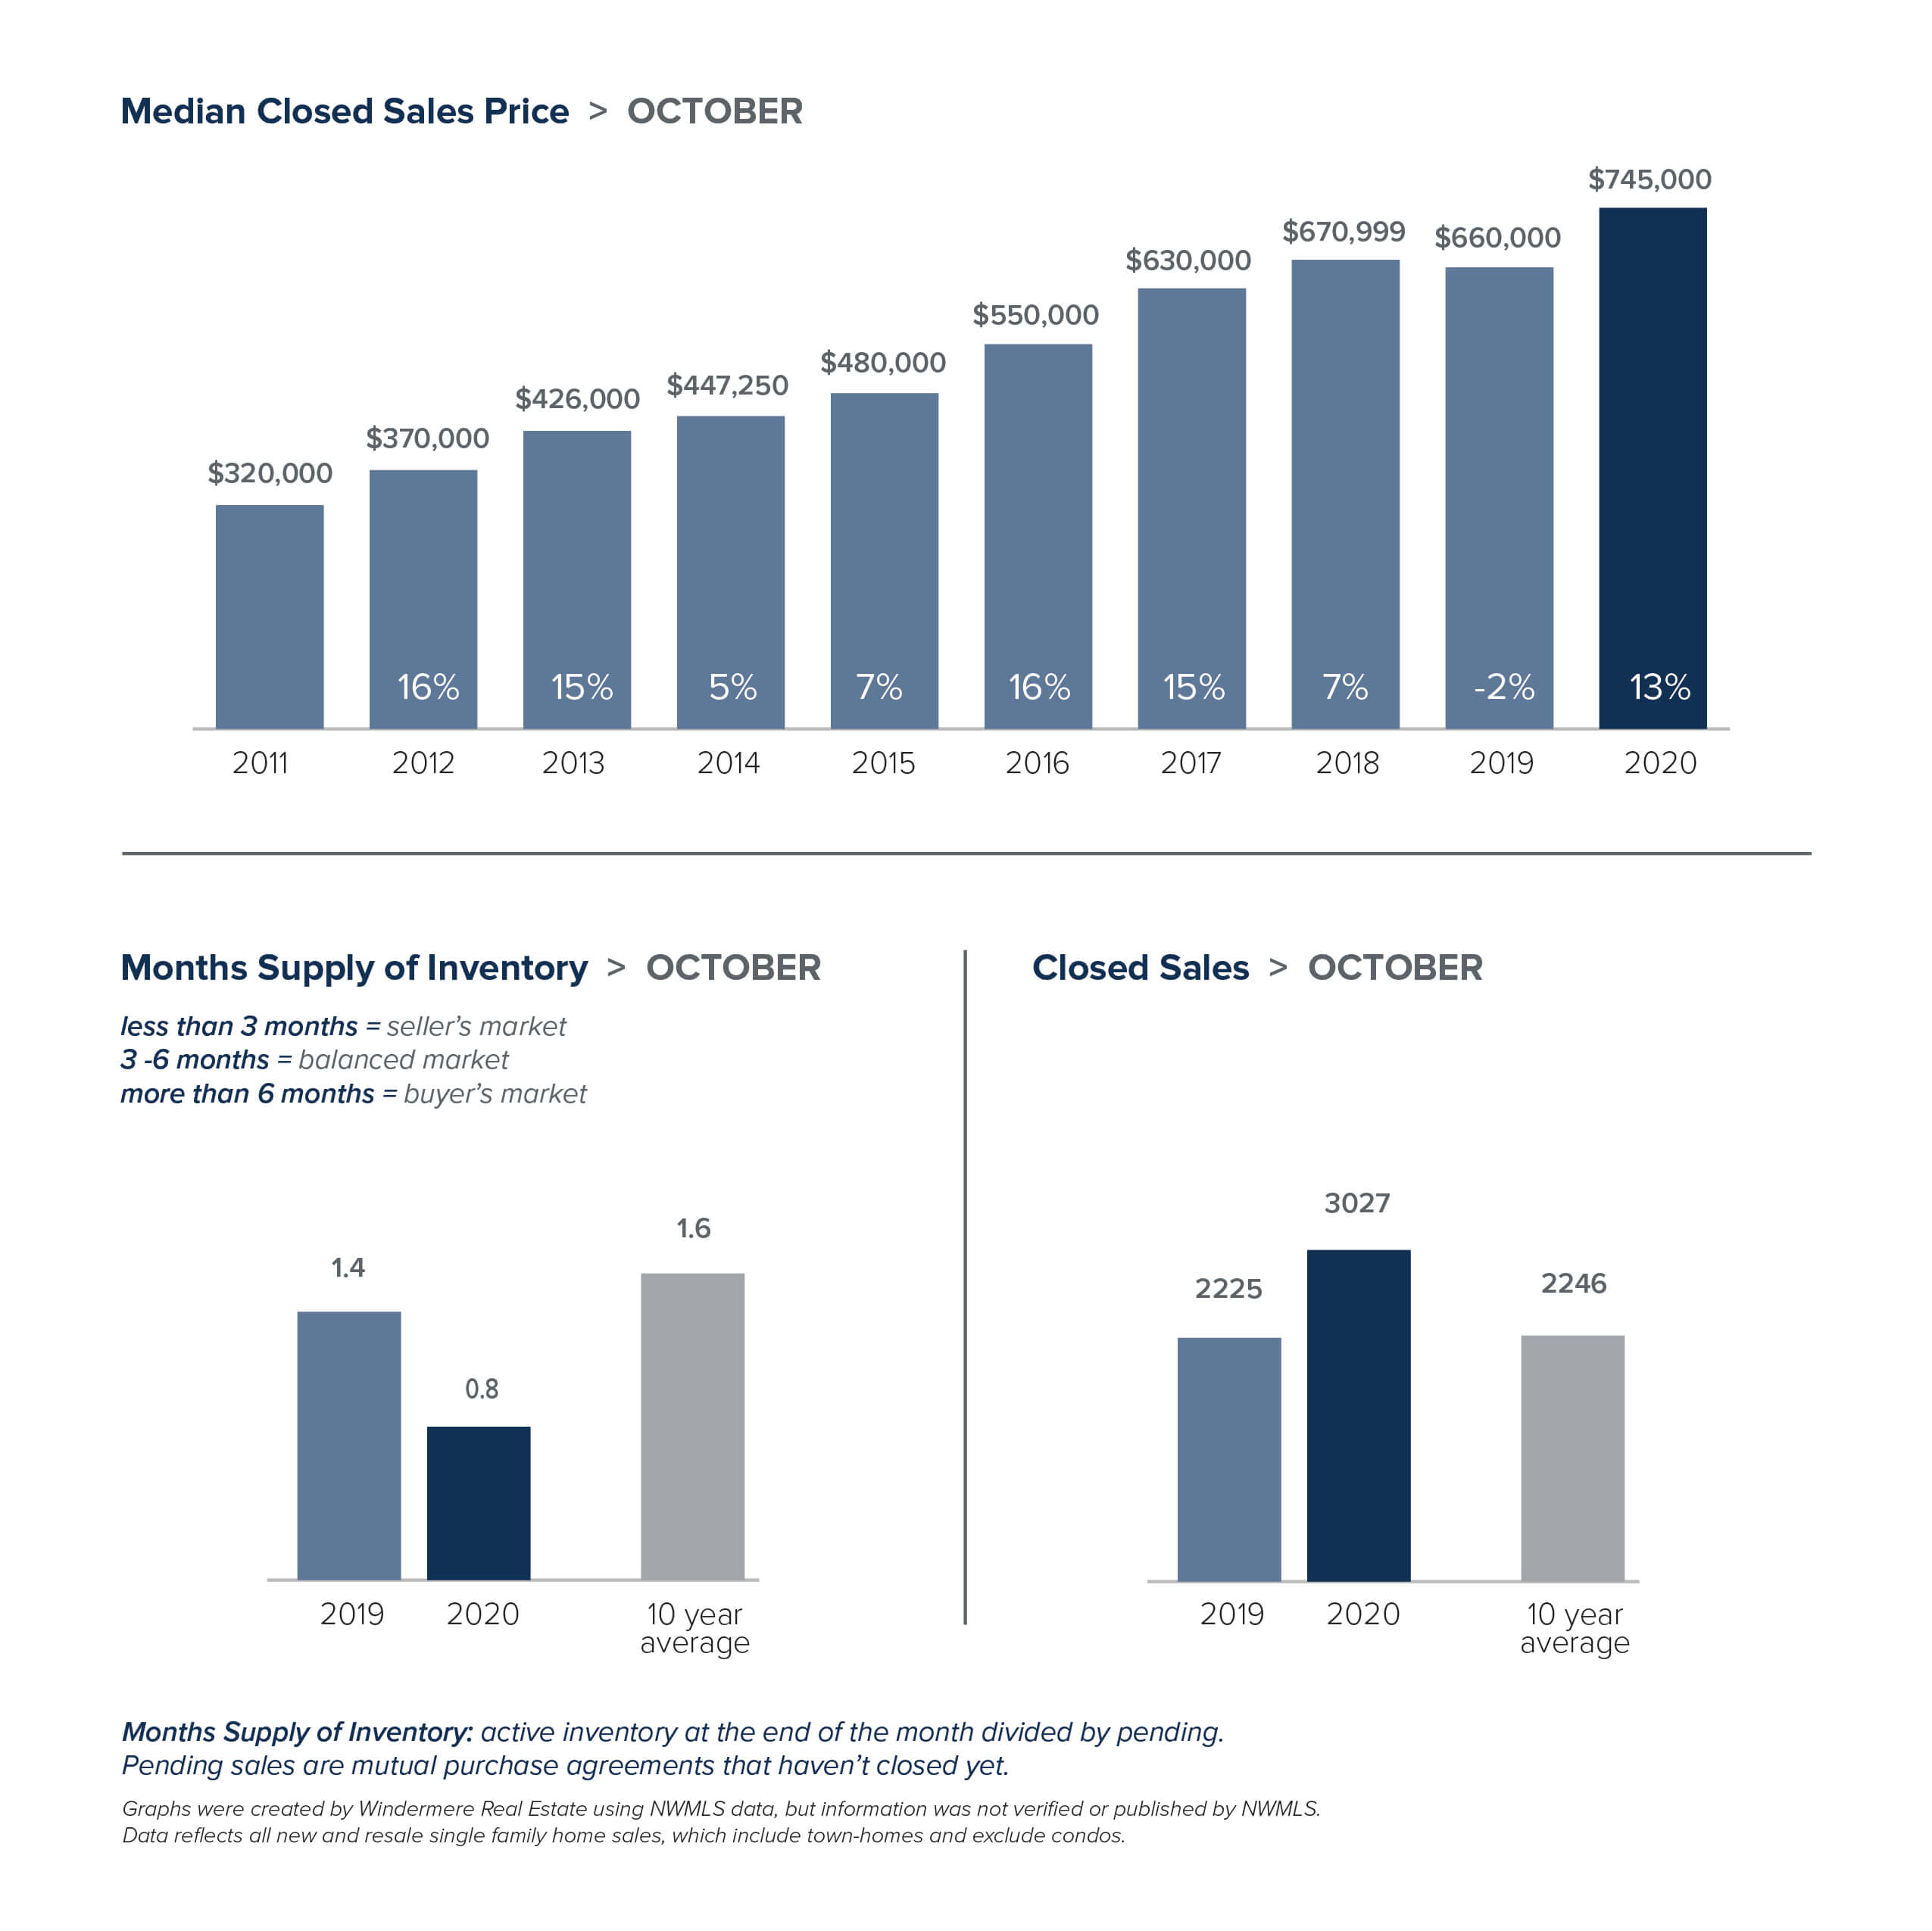
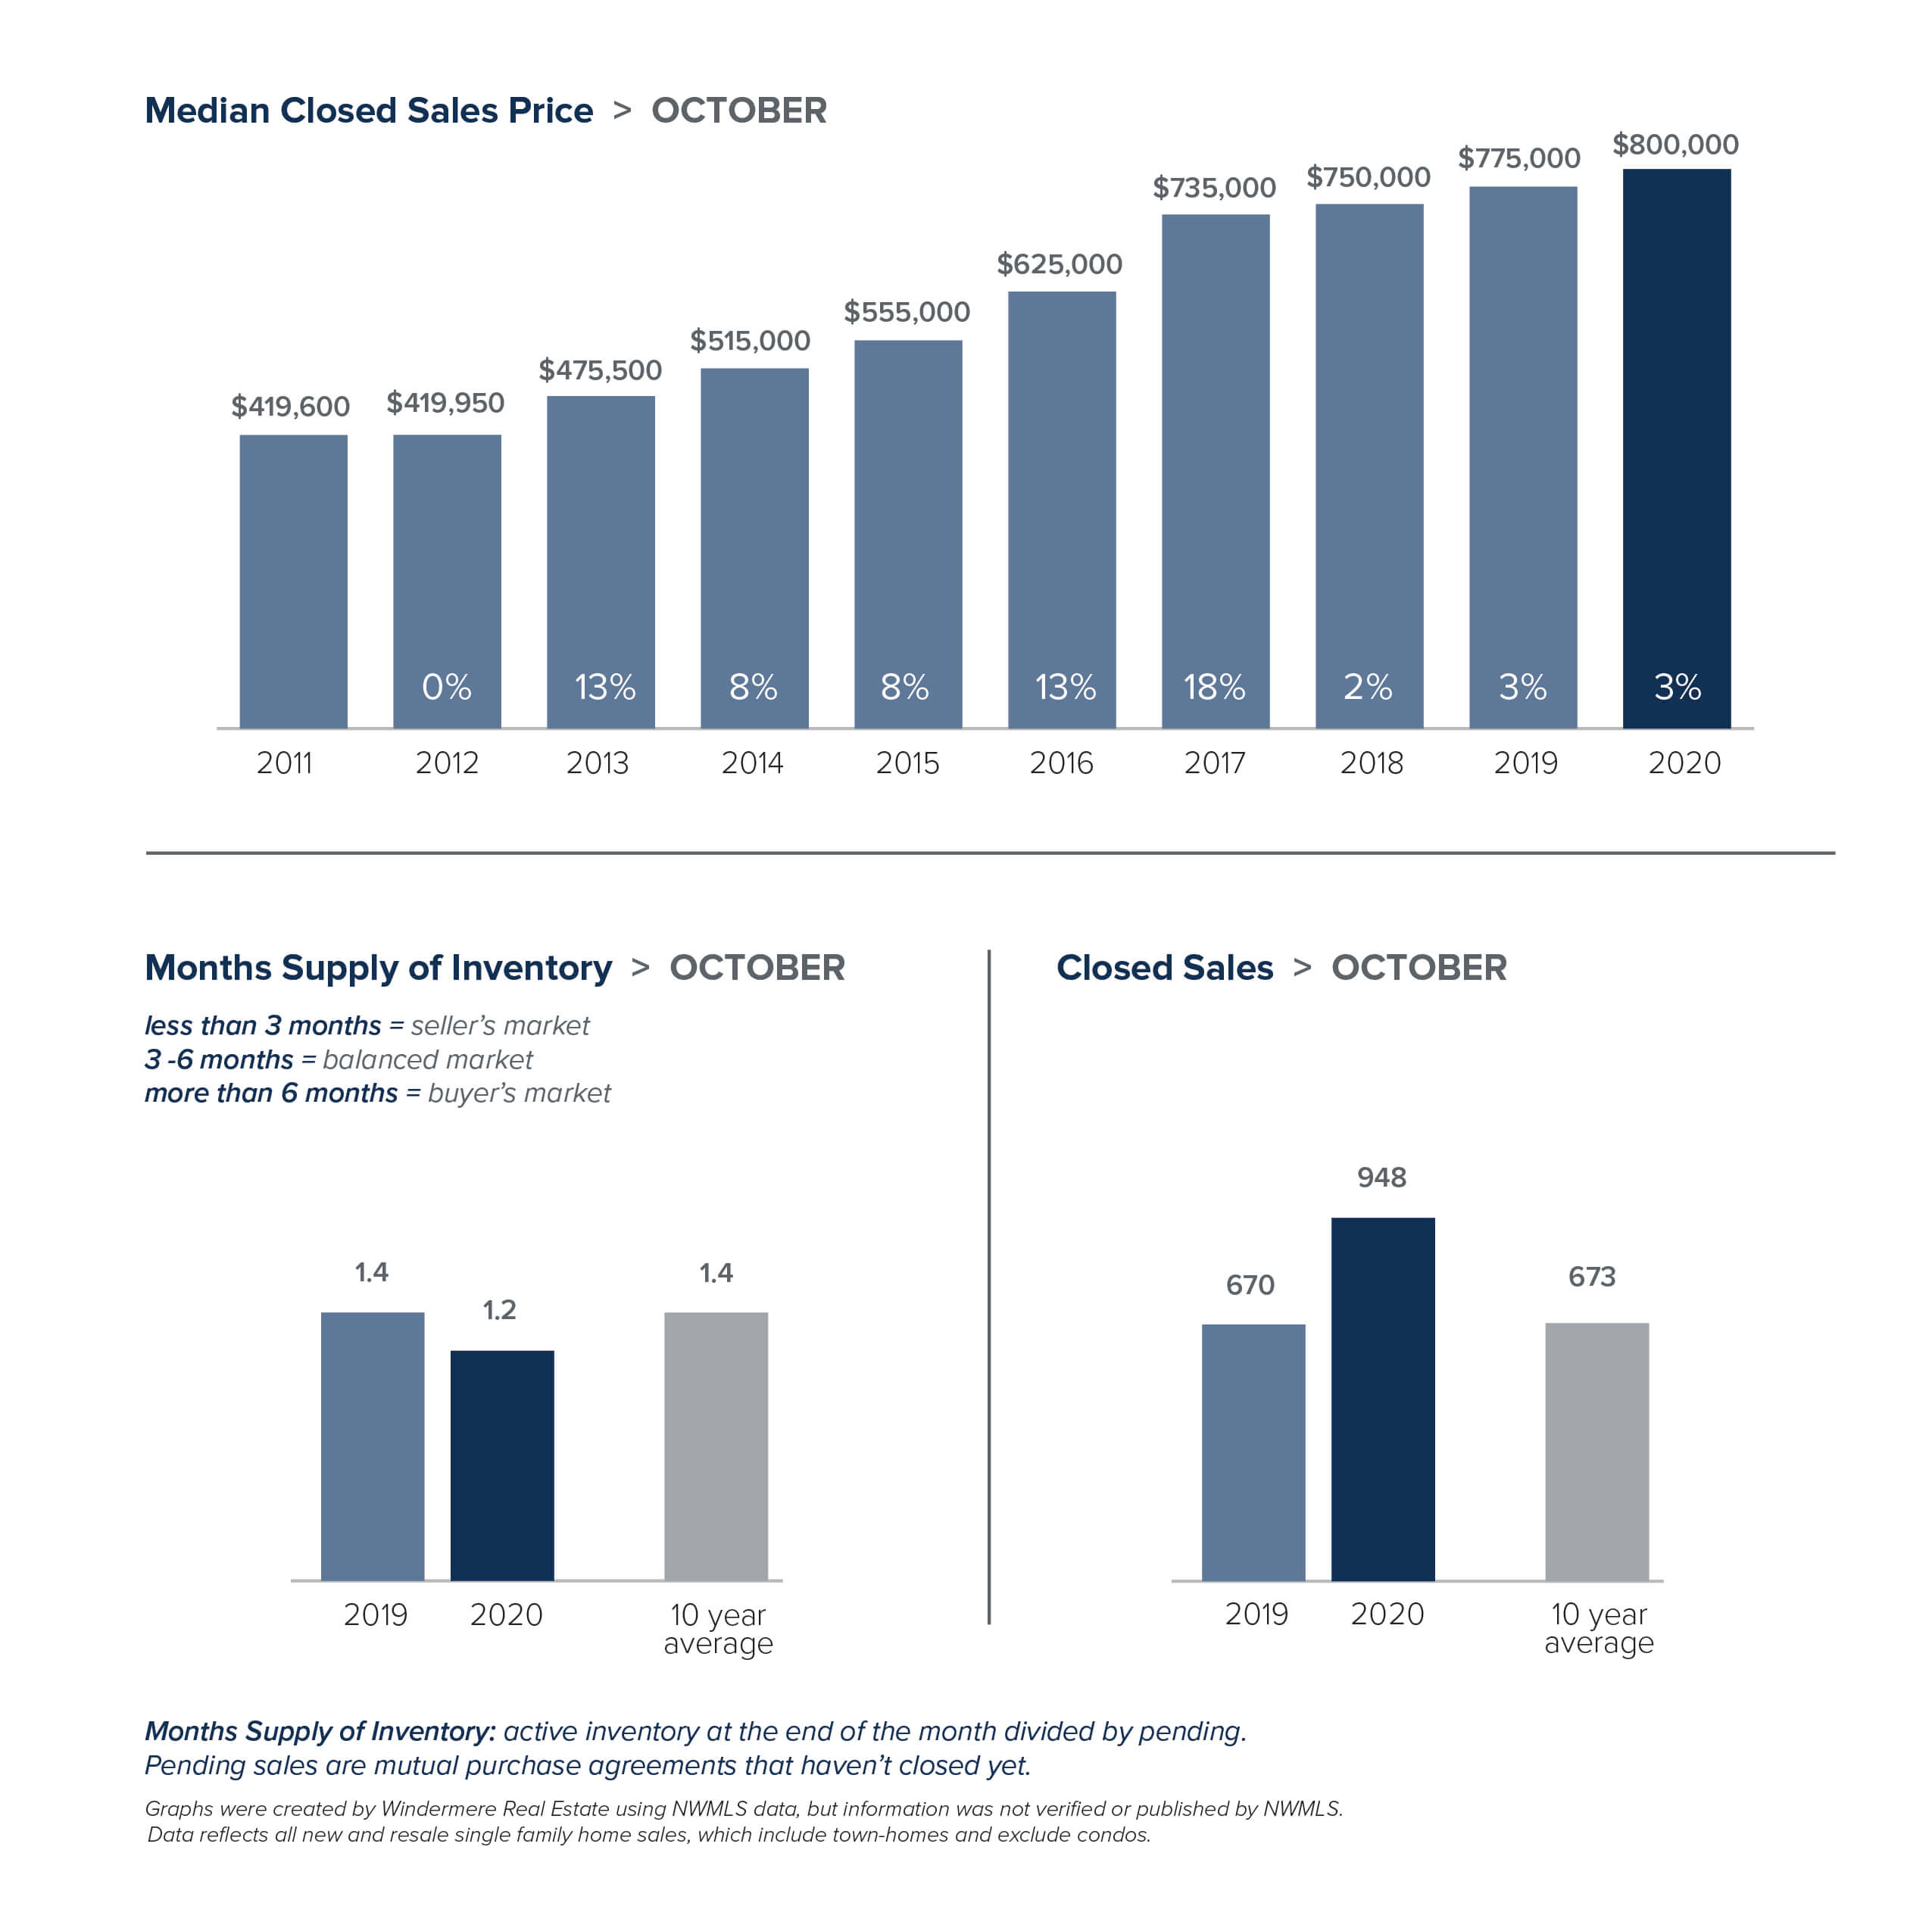
The number of people who can work remotely may be changing the way we view our homes, but one trend has not changed. The local housing market in October remained unseasonably hot. And that doesn’t show signs of changing any time soon.
October saw continued low inventory and record-level sales, with the number of sales exceeding that of 2019 year-to-date.
While new listings are on the rise, they are being snapped up quickly and many homes are selling in a matter of days. In King County there were 38% fewer single-family homes on the market as compared to a year ago. Snohomish County had 59% fewer listings. A four-month supply of homes for sale is considered a balanced market, but King and Snohomish counties currently have less than one month of supply.
With supply unable to keep up with demand, home prices are escalating at double-digit rates. The median single-family home price in King County rose 14% over a year ago to $745,000. Prices in Snohomish County jumped 17% year-over-year to a record high of $579,972. About half the homes that closed in October sold for over the asking price as compared to about a quarter of the homes the same time last year.
The real estate market here is uncommonly resilient. Growing employment in major tech industries and an enviable quality of life have made our region one of the fastest growing areas in the country. With interest rates remaining at record lows, we may well skip the traditional slowing in the winter market altogether.
The charts below provide a brief overview of market activity. If you are interested in more information, every Monday Windermere Chief Economist Matthew Gardner provides an update regarding the impact of COVID-19 on the US economy and housing market. You can get Matthew’s latest update here.
EASTSIDE
KING COUNTY
SEATTLE
SNOHOMISH COUNTY

VIEW FULL SNOHOMISH COUNTY REPORT
This post originally appeared on GetTheWReport.com
The Gardner Report – Q3 2020


The following analysis of the Western Washington real estate market is provided by Windermere Real Estate Chief Economist Matthew Gardner. We hope that this information may assist you with making better-informed real estate decisions. For further information about the housing market in your area, please don’t hesitate to contact your Windermere agent.
REGIONAL ECONOMIC OVERVIEW
Employment numbers in Western Washington continue to improve following the massive decline caused by COVID-19. For perspective, the area shed more than 373,000 jobs between February and April. However, the recovery has been fairly robust: almost 210,000 of those jobs have returned. Unemployment levels remain elevated; the current rate is 8.2%. That said, it is down from 16.6% in April. The rate, of course, varies across Western Washington counties, with a current low of 7.2% in King County and a high of 11.2% in Grays Harbor County. The economy is healing, but the pace of improvement has slowed somewhat, which is to be expected. That said, I anticipate that jobs will continue to return as long as we do not see another spike in new infections.
HOME SALES
- Sales continued to improve following the COVID-19-related drop in the first quarter of the year. There were 25,477 transactions in the quarter, an increase of 11.6% from the same period in 2019, and 45.9% higher than in the second quarter of this year.
- Listing activity remains woefully inadequate, with total available inventory 41.7% lower than a year ago, but 1.6% higher than in the second quarter of this year.
- Sales rose in all but two counties, though the declines were minimal. The greatest increase in sales was in San Juan County, which leads one to wonder if buyers are actively looking in more isolated markets given ongoing COVID-19-related concerns.
- Pending sales—a good gauge of future closings—rose 29% compared to the second quarter of the year, suggesting that fourth quarter closings will be positive.

HOME PRICES
- Home-price growth in Western Washington rose a remarkable 17.1% compared to a year ago. The average sale price was $611,793.
- When compared to the same period a year ago, price growth was strongest in Mason, Island, and San Juan counties. Only one county saw prices rise by less than ten percent.
- It was even more impressive to see the region’s home prices up by a very significant 9.4% compared to the second quarter of 2020. It is clear that low mortgage rates, combined with limited inventory, are pushing prices up.
- As long as mortgage rates stay low, and there isn’t an excessive spike in supply (which is highly unlikely), prices will continue to rise at above-average rates. That said, if this continues for too long, we will start to face affordability issues in many markets.

DAYS ON MARKET
- The average number of days it took to sell a home in the third quarter of this year dropped two days compared to a year ago.
- Snohomish County was the tightest market in Western Washington, with homes taking an average of only 16 days to sell. All but two counties—Lewis and San Juan—saw the length of time it took to sell a home rise compared to the same period a year ago.
- Across the region, it took an average of 36 days to sell a home in the quarter. It is also worth noting that it took an average of 4 fewer days to sell a home than in the second quarter of this year.
- The takeaway here is that significant increases in demand, in concert with remarkably low levels of inventory, continue to drive market time lower.

CONCLUSIONS

This speedometer reflects the state of the region’s real estate market using housing inventory, price gains, home sales, interest rates, and larger economic factors.
High demand, favorable interest rates, and low supply clearly point to a seller’s market in Western Washington. As such, I am moving the needle even more in favor of sellers.
As I suggested earlier in this report, although the market is remarkably buoyant, I am starting to see affordability issues increase in many areas—not just in the central Puget Sound region—and this is concerning. Perhaps the winter will act to cool the market, but something is telling me we shouldn’t count on it.
ABOUT MATTHEW GARDNER
 As Chief Economist for Windermere Real Estate, Matthew Gardner is responsible for analyzing and interpreting economic data and its impact on the real estate market on both a local and national level. Matthew has over 30 years of professional experience both in the U.S. and U.K.
In addition to his day-to-day responsibilities, Matthew sits on the Washington State Governors Council of Economic Advisors; chairs the Board of Trustees at the Washington Center for Real Estate Research at the University of Washington; and is an Advisory Board Member at the Runstad Center for Real Estate Studies at the University of Washington where he also lectures in real estate economics.
This post originally appeared on the Windermere.com Blog
Local Market Update – October 2020

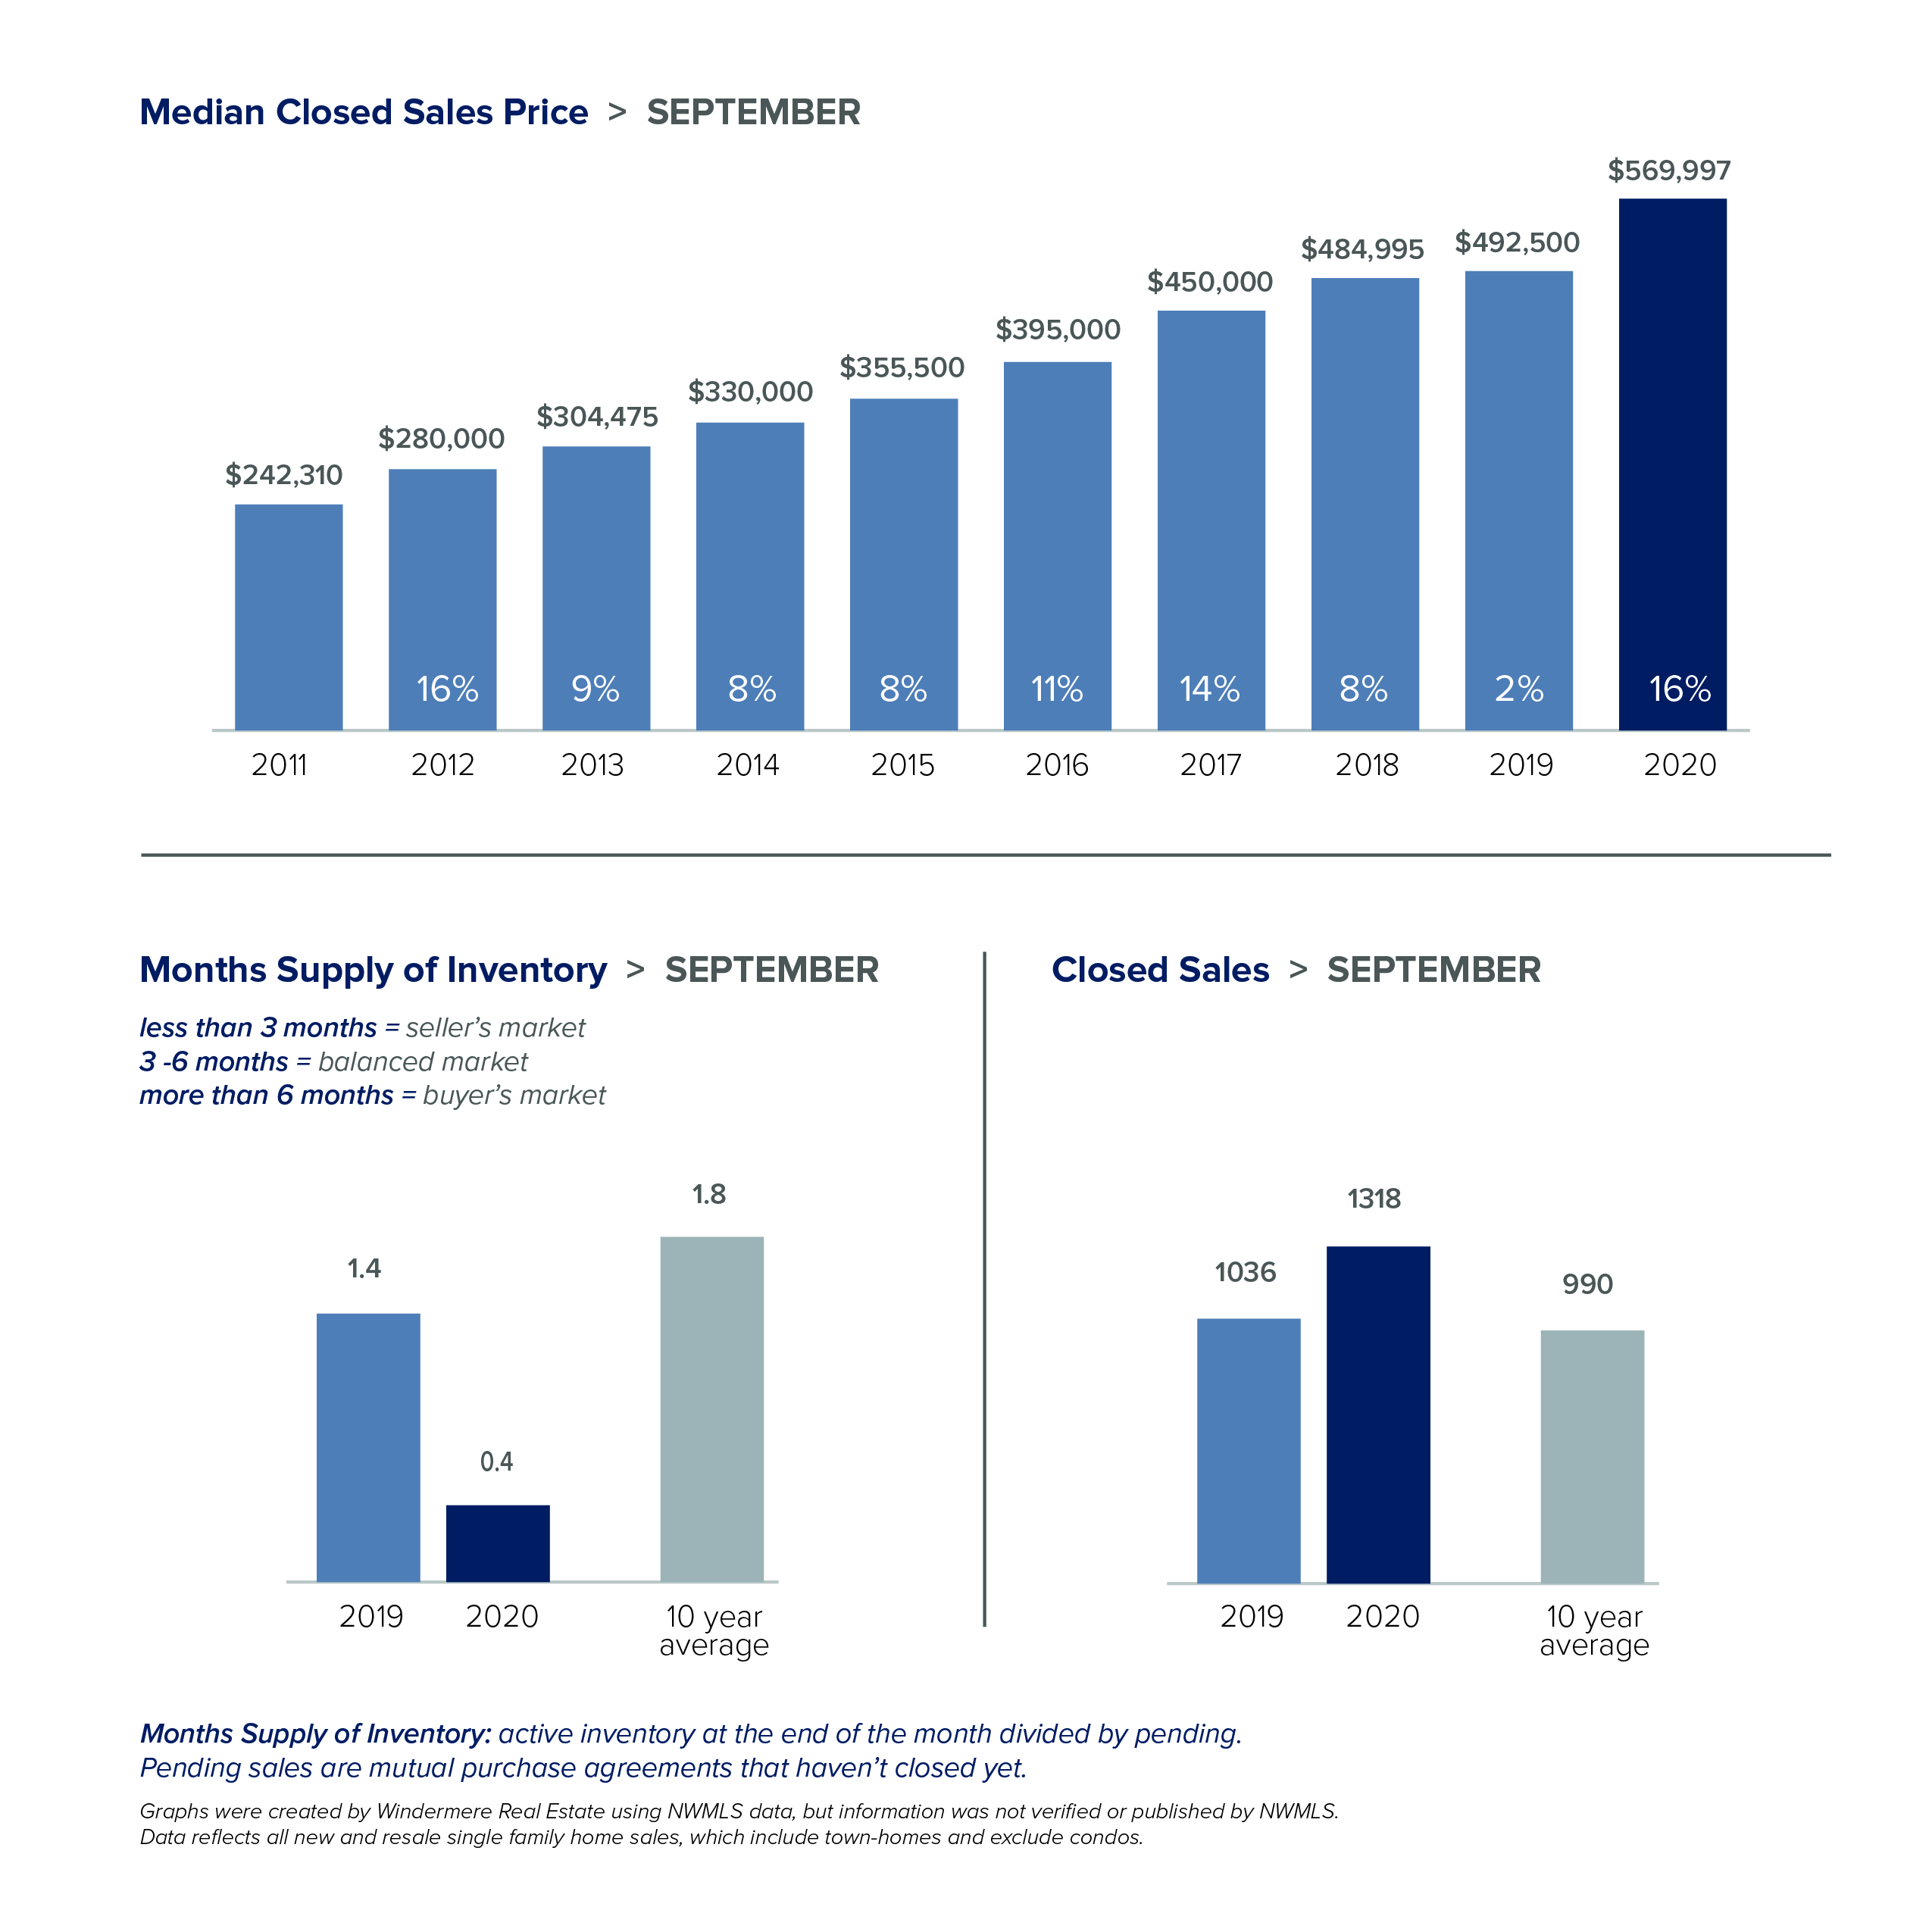
While daily life may seem unpredictable, the local real estate market remains extremely stable. Activity in September acted more like the traditional peak spring market with home sales soaring and prices hitting record highs. Inventory remains very tight and new listings are selling quickly in every price range.
There just aren’t enough homes on the market to meet demand. King County had about half the inventory of a year ago. Snohomish County had 63% fewer available homes. On the other hand, the number of condos on the market in King County jumped by 24% over last September. Brokers attribute the flood of new inventory to COVID remote workers looking to trade their in-city condo for more living space. Despite the increase in inventory, condo prices rose 8% in September and pending sales — the best indicator of current demand — shot up 36% over the same period last year.
The slim supply of single-family homes means bidding wars and all-cash offers were the norm, driving prices to record highs. King County saw the third consecutive month of record-setting values. The median home price hit $753,600 in September, a 14% jump over last year. Prices in Snohomish County soared 16% from a year ago to $569,997, just shy of its all-time high of $575,000. For both counties, half the homes sold for over list price in September as compared with just a quarter of the homes a year ago.
The market doesn’t show signs of cooling off any time soon. In September the greater Northwest area saw the highest number of transactions since June 2018. Pending sales were up 32% in King County and 29% in Snohomish County. Interest rates continue to be at historic lows. With the area posting some of the fastest population growth in the country, expect the market to stay unseasonably hot.
The charts below provide a brief overview of market activity. If you are interested in more information, every Monday Windermere Chief Economist Matthew Gardner provides an update regarding the impact of COVID-19 on the US economy and housing market. You can get Matthew’s latest update here.
EASTSIDE
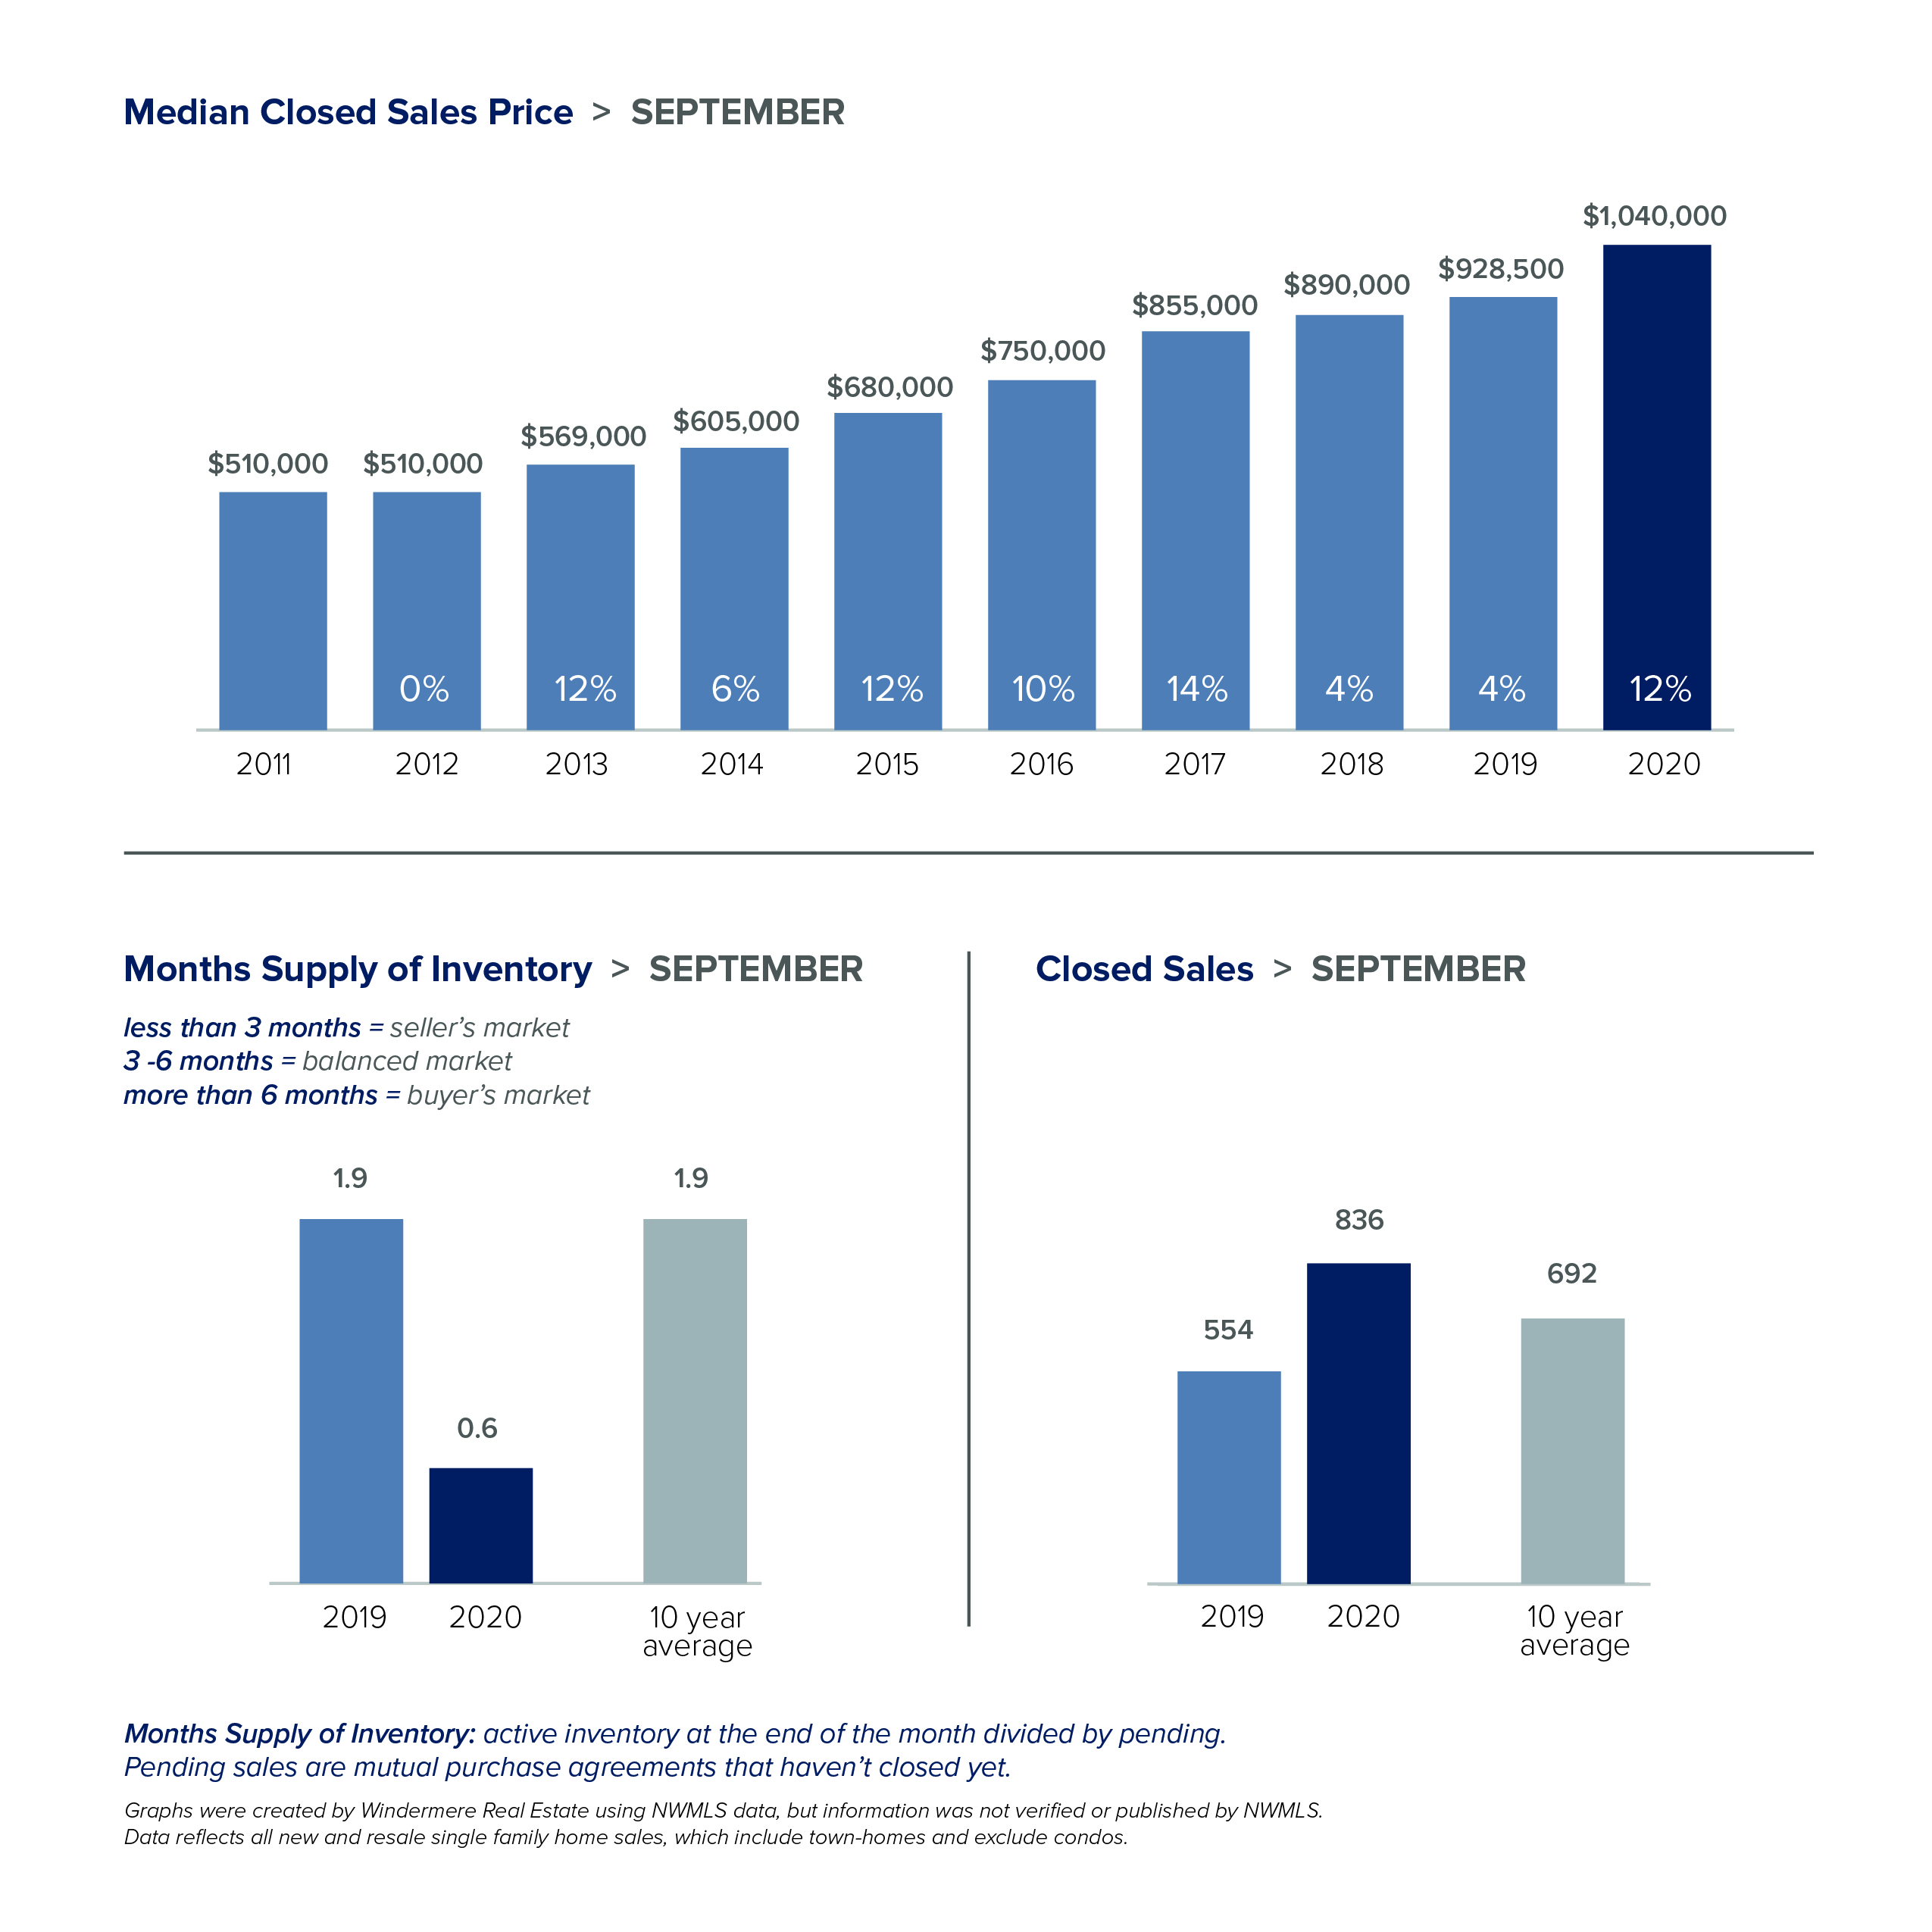
KING COUNTY

SEATTLE
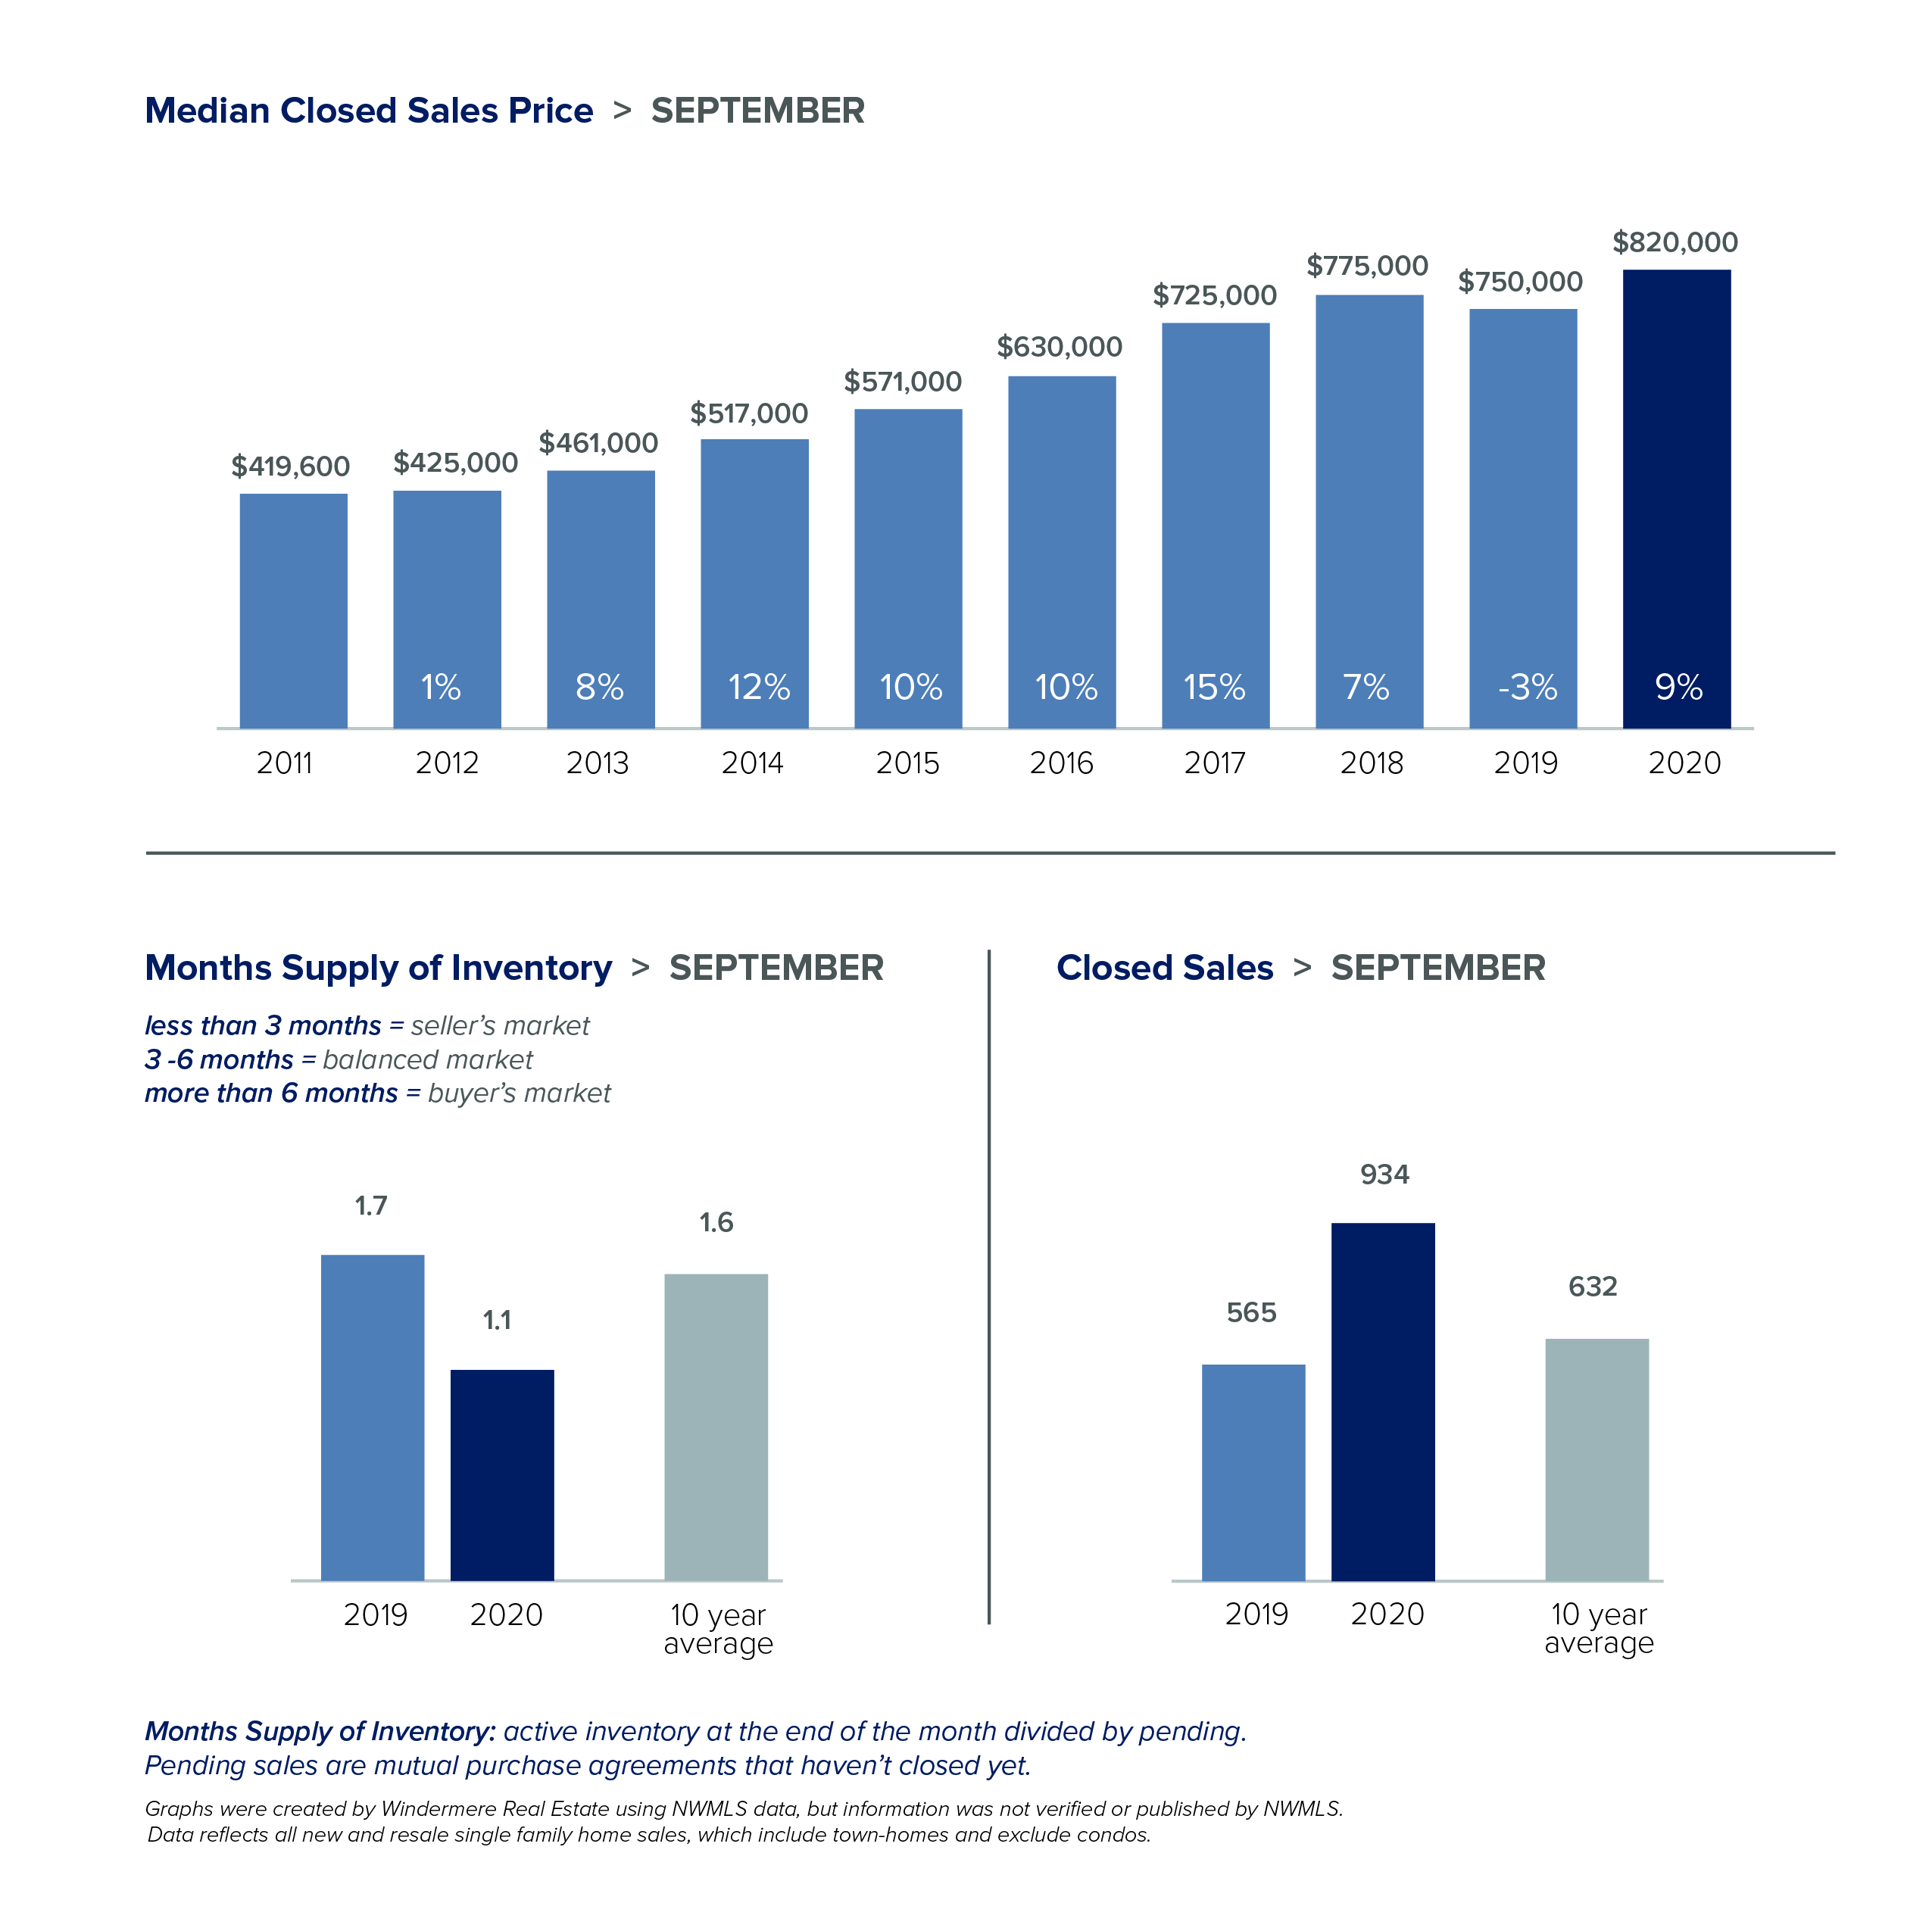
SNOHOMISH COUNTY
VIEW FULL SNOHOMISH COUNTY REPORT
This post originally appeared on GettheWReport.com
